


Canada’s latest headline Consumer Price Index (CPI) dropped to 1.8% in February, landing a couple of notches below the Bank of Canada’s 2% target for the first time in years.
Mission accomplished, right?
Not quite. Behind that tidy number is a cocktail of tax distortions, stale data, and a geopolitical shock already rewriting the inflation outlook in real time.
Here’s what’s actually going on and what it means for the Canadian dollar.
Headline vs. Core: What’s the Difference?
Before diving in, it helps to understand the two main ways inflation gets measured.
Headline inflation is the “everything” number. It captures price changes across the full basket of goods consumers buy: groceries, rent, gas, clothing, you name it. It’s what you feel in your wallet. But it can swing wildly based on things like a spike in oil prices or a bad harvest season.
Core inflation is what central banks actually care about. In particular, the Bank of Canada tracks special measures called CPI-trim and CPI-median that strip out the most volatile items to reveal the underlying trend. Think of it as inflation with the noise turned down.
In February, while the headline CPI came in at 1.8%, core measures averaged 2.3%. That gap matters because it tells us the “guts” of inflation are still running warmer than the headline suggests.
The GST Ghost: How Tax Breaks Distort the Numbers
Here’s where it gets a little tricky.
Inflation is calculated by comparing today’s prices to prices from exactly 12 months ago. The formula looks like this:
Inflation Rate = (Price Today ÷ Price One Year Ago – 1) × 100
So, whatever happened a year ago directly affects how today’s number looks. That’s called a base effect.
In late 2024, the Canadian government introduced a temporary GST/HST tax break on certain goods — restaurant meals, alcohol, and toys. Prices on those items dropped while the break was in place. When the break ended in February 2025, prices snapped back up.
Now fast-forward to today. We’re comparing February 2026 prices against those elevated post-tax-holiday prices from a year ago. The math makes today’s inflation look lower than it really is, not because prices are genuinely falling, but because last year’s comparison point was unusually high.
This is a base effect distortion. The Bank of Canada (BOC) has to mentally filter it out to see the real picture. And crucially, Statistics Canada itself said this distortion was the main reason the February headline dropped so sharply.
Promoted: Stop Risking Your Own Capital on Unpredictable Trade Policies.
You’ve seen how inflation concerns can cloud the Loonie’s outlook, but playing big macro shifts requires serious capital. With FundingPips, you trade a simulated account and can earn up to 100% of your rewards. Whether you’re looking for a 2 Step PRO evaluation starting at just $26 or seeking funding options up to $300K, you have the flexibility to trade your way.
Learn more about FundingPips and use code HELLO to get 20% OFF your first purchase!
Disclosure: We may earn a commission from our partners if you sign up through our links, at no extra cost to you.
The Rearview Mirror Problem
Remember that CPI data is a lagging indicator. It tells you what was happening weeks ago, not what’s happening right now.
The February report was finalized just as the U.S.-Israel conflict with Iran sent global oil markets skyrocketing. Since late February, Brent crude has surged from around $70 to over $100 a barrel, briefly spiking to nearly $120. Gas prices in the U.S. have jumped nearly 80 cents a gallon in three weeks, the biggest monthly gain since Hurricane Katrina.
Canada isn’t immune. Energy prices were actually falling in the February CPI data — gasoline was down 14.2% year-over-year, a major reason the headline looked so tame. That tailwind has now become a headwind. But those higher prices won’t show up in the official data until the March CPI release on April 20. Yipes!
This creates a painful policy timing mismatch for the Bank of Canada:
- The data says: inflation is 1.8% = room to cut rates
- The real world says: oil is surging = pump the brakes
- The dilemma: Cut now based on stale numbers and risk overstimulating an economy about to get slapped by an energy shock
Why the Canadian Dollar Is Under Pressure
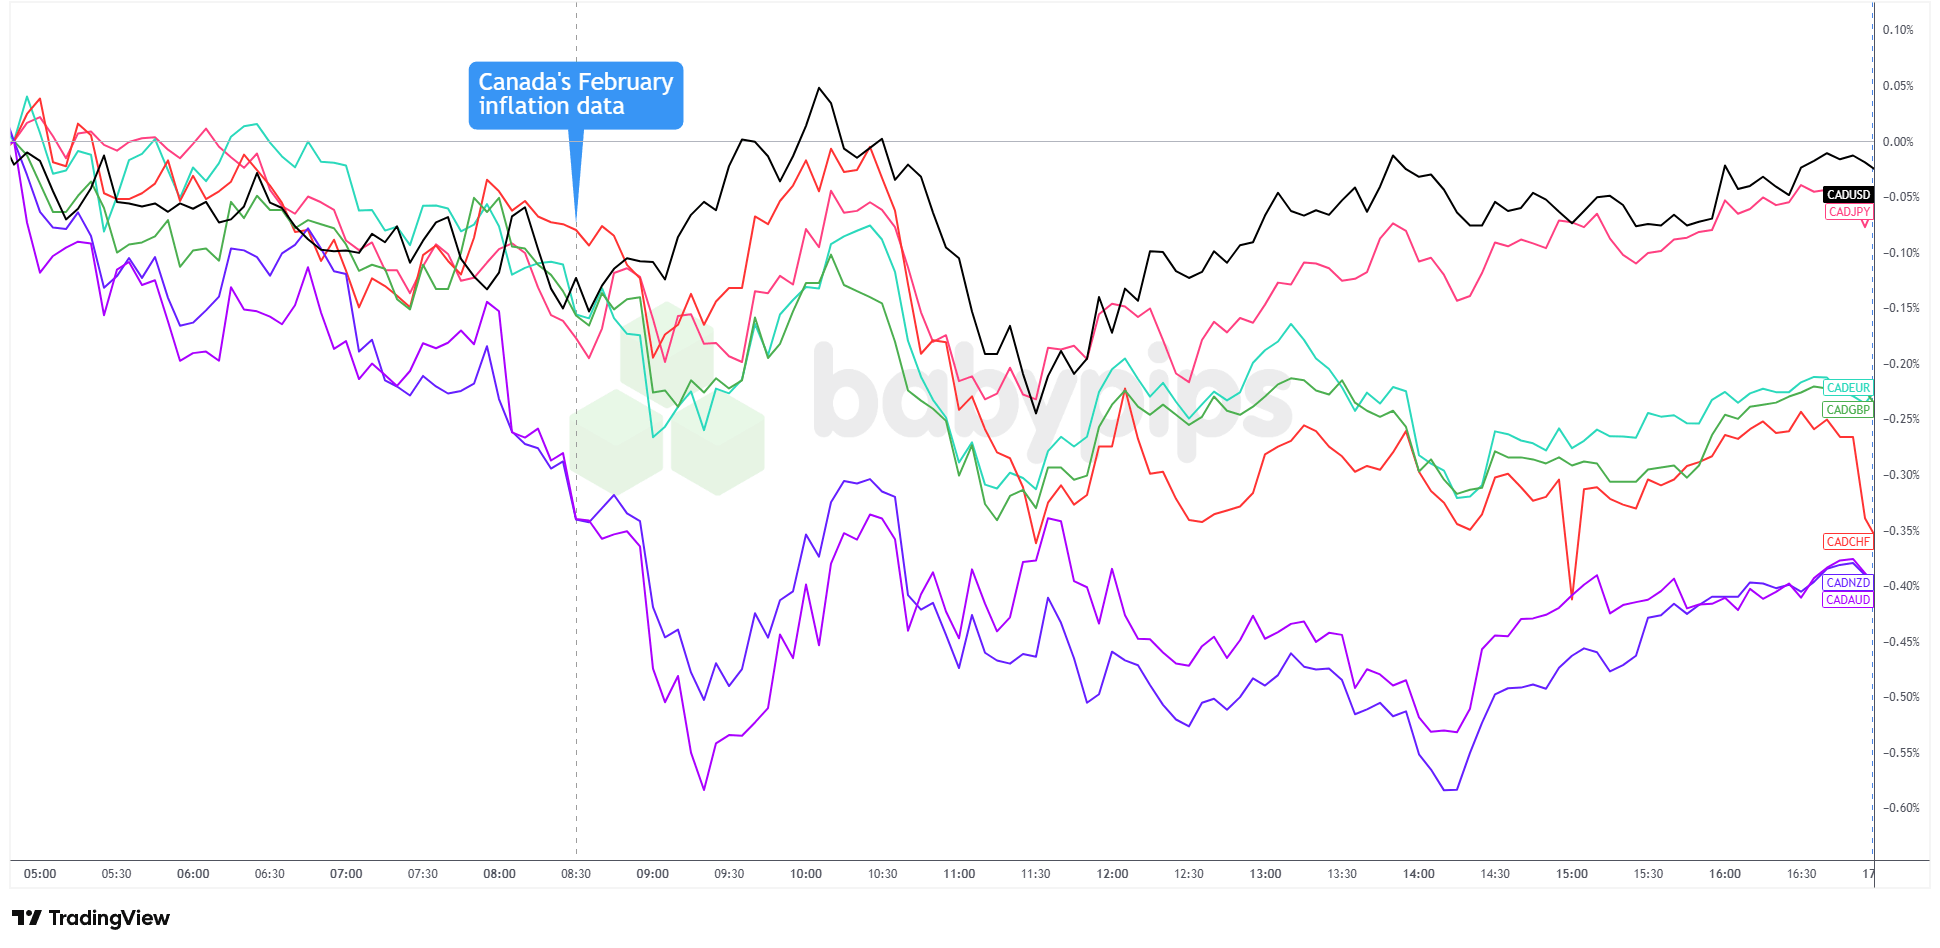
Soft inflation data raises expectations for interest rate cuts. Lower rates make a currency less attractive to hold, as investors chase higher returns elsewhere. That’s part of why the CAD has been under pressure against the USD since the report dropped.
Overlay of CAD vs. Major Currencies Chart by TradingView
But the Loonie faces a more complicated picture than just rate expectations. Canada is a major oil exporter, which means surging crude prices are a mixed signal:
- Good for energy revenues
- Bad for inflation
If oil stays elevated, the BOC’s ability to cut rates becomes more constrained — not less. The currency is caught in a tug-of-war between the two forces.
This is likely why CAD is also facing pressure from other commodity currencies like the Australian dollar (AUD) and Norwegian krone (NOK) that are better positioned to benefit from the oil spike without the same inflation-policy headache.
When Canada looks like it might cut rates while energy exporters elsewhere hold firm, the Loonie tends to underperform across the board, not just against the greenback.
Key Lessons for Traders
Numbers can be technically accurate and still misleading. A 1.8% headline driven by tax distortions tells a very different story than 1.8% driven by genuine price stability. Always ask why the number moved, not just what it says.
Data has an expiry date. CPI is backward-looking by design. When the world changes fast — as it did with the Iran oil shock — the most recent report can become outdated almost overnight.
For CAD, oil is never just background noise. The Canadian dollar is deeply sensitive to crude prices. An oil shock doesn’t just affect inflation: it shapes rate expectations, trade revenues, and investor appetite for the Loonie all at once.
The Bottom Line
Canada’s 1.8% inflation print is real, but it’s not the full story. Tax distortions pushed the headline number lower than underlying conditions warrant, core inflation is still running above target, and a major oil shock is already building that the data simply hasn’t captured yet.
Watch the March CPI release on April 20 and the Bank of Canada’s rate decision on April 29. That’s when policymakers will have to square today’s tame-looking data with an energy market that has anything but calmed down.
This article is for educational purposes only. It does not constitute financial advice. Trading involves substantial risk, and past performance is not indicative of future results. Always do your own research and consider consulting with a qualified financial advisor.
Promoted: Master Your Execution During Macro Shocks
When the Canadian dollar struggles with lack of BOC policy clarity, does your execution stay clinical or get emotional? TradeZella’s trade replay tool lets you revisit your past trades tick-by-tick. See exactly where your entry slipped or why you hesitated, so you can dominate the next volatility spike with a data-driven playbook.
Start Your Journal with Tradezella and use code “PIPS20” to save 20% on your first purchase!
Disclosure: To help support our free daily content, we may earn a commission from our partners if you sign up through our links, at no extra cost to you.