GBP/USD Price Forecast: Snaps three-day losing streak as market sentiment improves
The GBP/USD pair snaps its three-day losing streak on Friday, trading 0.1% higher to near 1.3345 during the Asian trading session. The Cable rises as the market sentiment turns favorable for riskier assets, following United States (US) President Donald Trump’s extended pause on scheduled attacks on Iranian power plants until April 6, which boosts hopes of de-escalation in conflicts in the Middle East.
As of writing, S&P 500 futures trade 0.3% higher to near 6,500, indicating an improvement in investors’ risk appetite. Meanwhile, the US Dollar Index (DXY), which tracks the Greenback’s value against six major currencies, trades flat near a three-day high of around 100.00. Read more…
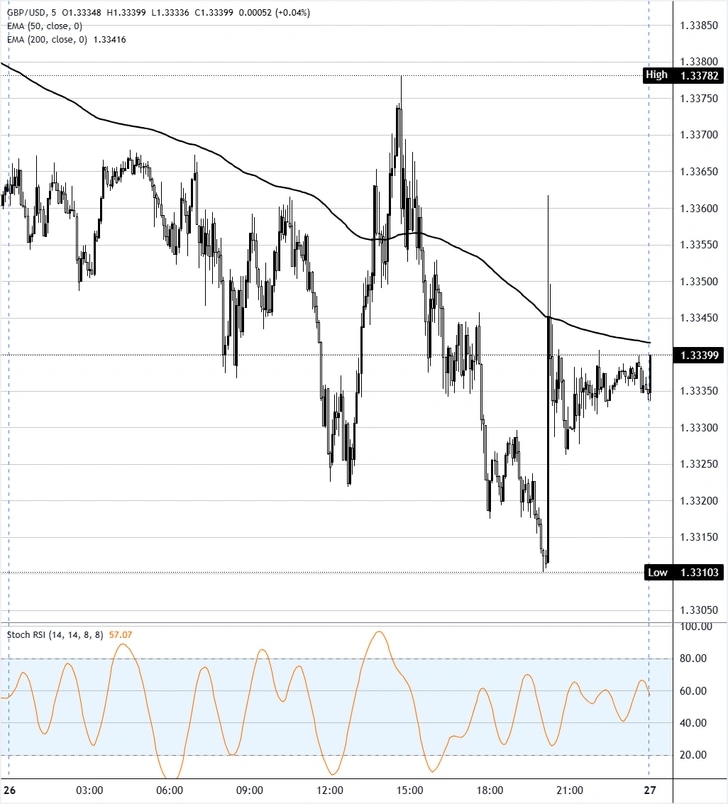
GBP/USD drifts lower as Iran oil shock clouds the BoE rate outlook
GBP/USD slipped about 0.1% on Thursday, settling around 1.3340 in a choppy session. The pair has been trading in a roughly 200-pip range between 1.3230 and 1.3430 for most of March, with a series of lower highs since the late-January peak close to 1.3820 pointing to a gradual loss of upside momentum. Thursday’s candle showed a brief spike lower toward 1.3310 during the US session before buyers stepped in to recover some ground.
The Bank of England (BoE) held Bank Rate at 3.75% at its March 19 meeting in a unanimous vote, a stark shift from the 5-4 split in February when a cut had been a realistic prospect. The war in the Middle East and the effective closure of the Strait of Hormuz have transformed the UK rate outlook; markets that had been pricing in two cuts before the conflict are now expecting rates to hold for the rest of 2026 or even rise. The BoE warned that Consumer Price Index (CPI) inflation, which held at 3% in February, could climb to 3.5% in the coming quarters as energy costs feed through. Read more…
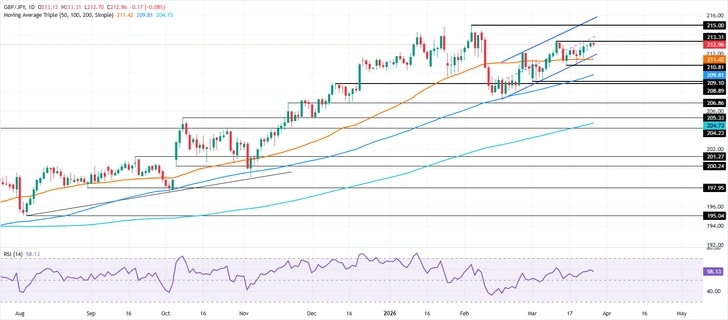
GBP/JPY Price Forecast: Stalls at 213.00 as bearish flag looms
The GBP/JPY consolidates around 213.00 for the second straight day, losses 0.09%, snapping a four-day streak of consecutive gains as traders clash with key resistance at the March 11 peak at 213.31. The technical picture shows GBP/JPY trading within the 211.00-213.00 range over the last 9 days, range-bound amid the lack of a clear catalyst. Additionally, it remains within a bearish flag, which, if confirmed, could open the door for further downside.
Momentum, as measured by the Relative Strength Index (RSI), is bullish, but the slope is trending lower, indicating neither buyers nor sellers are in charge. For a bullish continuation, the GBP/JPY must clear the top of the range at 213.00. Once surpassed, the next stop would be the year-to-date (YTD) high at 215.00. Read more…