
 reclaims key support, 30% rally in sight")

At press time, RaveDAO [RAVE] climbed over 16.45% and is trading at $0.2475. Notably, a surge in market participation has been recorded, as reflected in the trading volume, which jumped 125% to $88.15 million. This indicates strong interest from investors and traders in the asset.
This rally may open the door for further upside, as the chart structure turns bullish and both investors and traders support the optimistic outlook.
RAVE price action eyes 30% upside potential
While taking a more in-depth look at the price action, it appears that RAVE has reclaimed its key support at $0.2338.
According to AMBCrypto’s technical analysis, RAVE appears bullish and is poised for a price uptick. Not only because it has reclaimed this key support but also because it has broken out of a descending trendline that the asset had been following for the past six days.
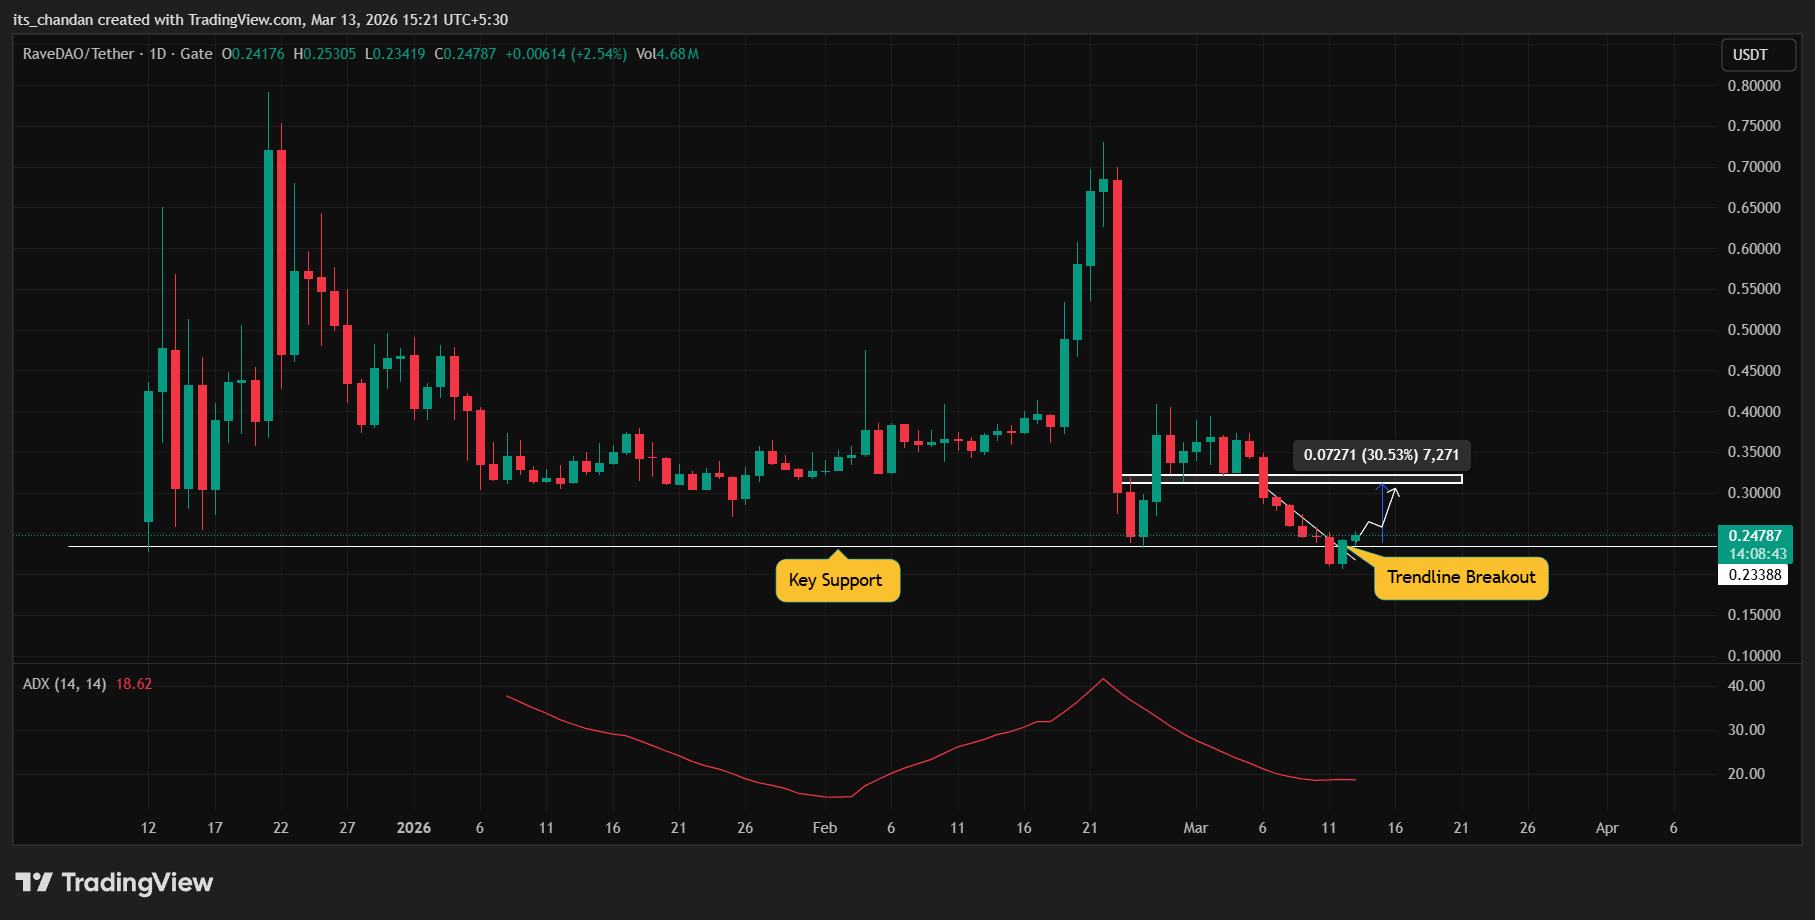
Based on the current price action, if the RAVE price remains above the $0.2338 level, it could see another 30% price uptick and potentially reach the $0.312 level. However, a reversal could also occur if the price loses this key support again.
Despite the potential for an upward price reversal, the technical indicator Average Directional Index (ADX), which measures trend strength, stood at 18.62 at press time, below the key threshold of 25. This indicates that the asset currently has weak directional momentum.
RAVE: Investor and trader sentiment turns optimistic
In addition to price action, another factor reinforcing RAVE’s bullish outlook is the derivatives data.
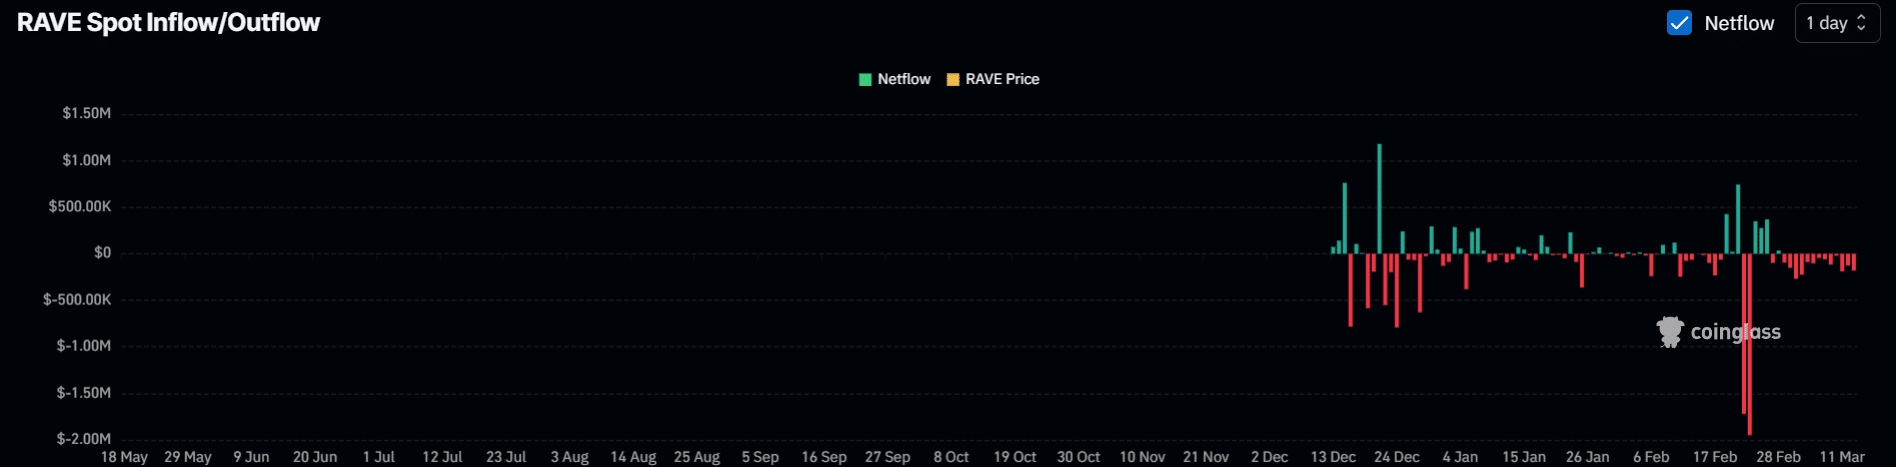
According to CoinGlass’s RAVE spot inflow/outflow metric, the asset has been continuously flowing out of exchanges since the 1st of March 2026. Over the past 48 hours, exchanges have recorded a modest outflow of $309K worth of RAVE, indicating potential accumulation.
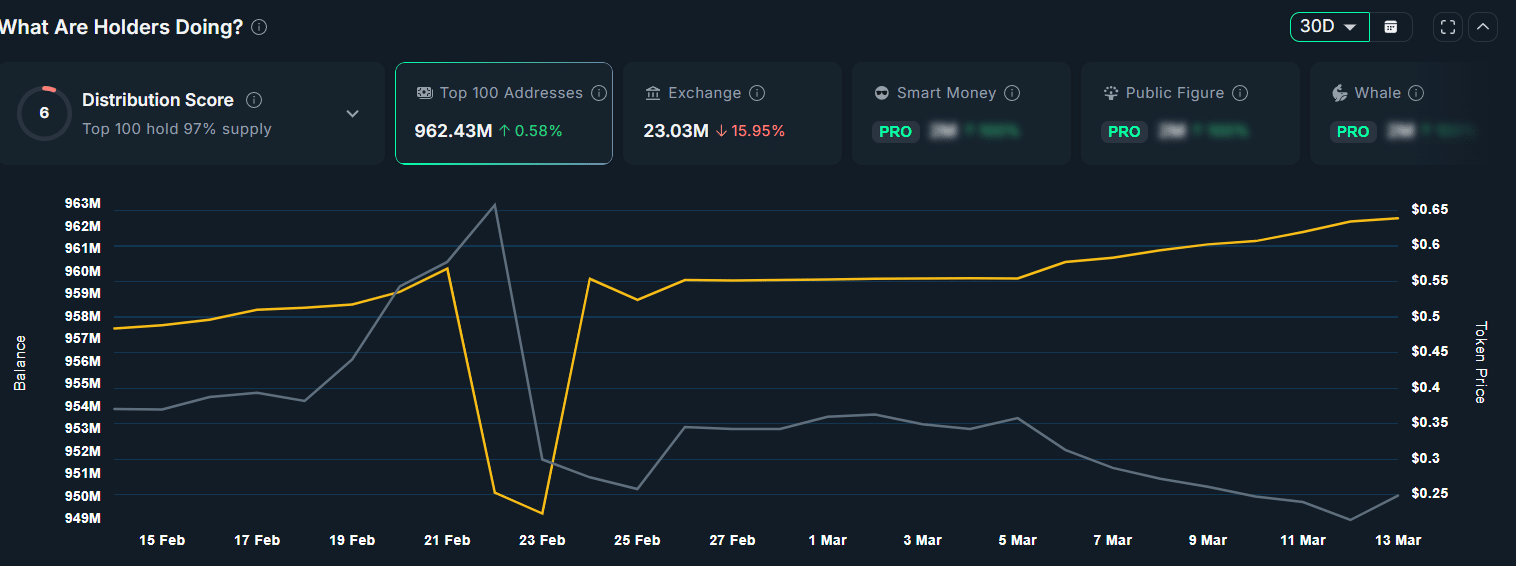
Whereas, Nansen discloses that over the past thirty days, the top 100 wallet addresses of RAVE have increased their holdings by 962.42 million, equivalent to 0.58%. Meanwhile, exchange reserves have declined by 15.98%, indicating strong accumulation.
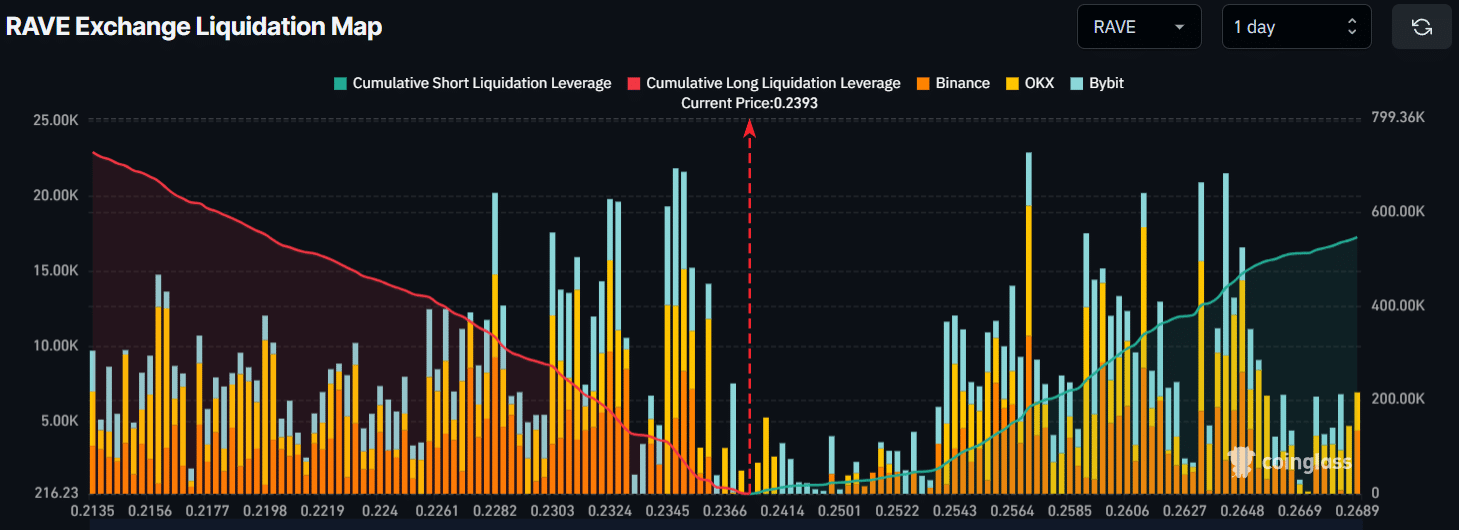
Intraday traders appear to be following the trend as well. Data from the RAVE exchange liquidation map shows traders are over‑leveraged between $0.2282 on the lower side and $0.257 on the upper side.
At these levels, they have built $333.45K in long‑leveraged positions versus $162.34K in short‑leveraged positions. Such leveraging highlights that bullish bets currently outweigh bearish ones.
When combining all these data and metrics, RAVE appears bullish in both the long term and short term, but only if it remains above the key support level.
Final Summary
- RaveDAO appears bullish as it reclaimed the key support level of $0.2338.
- Investors and traders seem to be accumulating and betting on long positions, which reinforces RAVE’s bullish outlook.