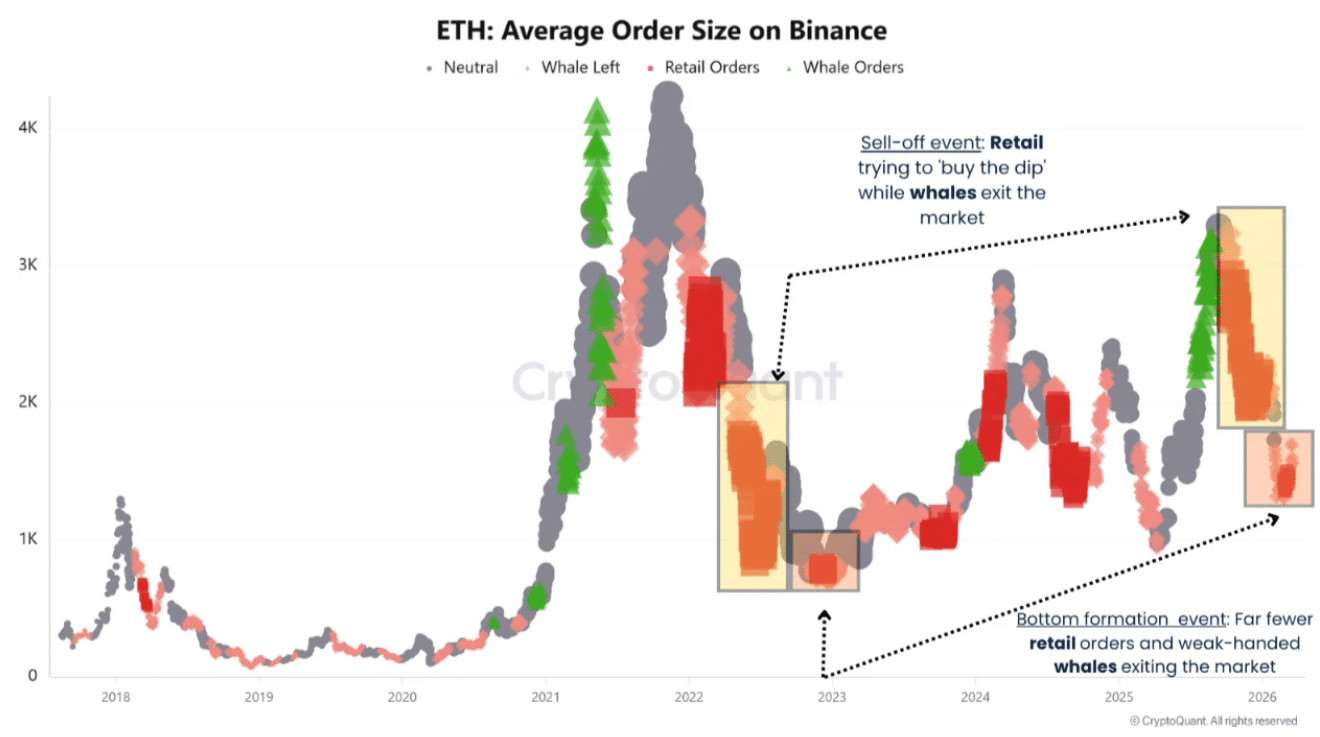
Ethereum’s [ETH] average order size on Binance outlines a structural shift in the forces driving the market. Early in the cycle, whale orders clustered above $3,000, signaling deliberate accumulation before the 2021 rally. As price expanded, that positioning translated into sustained upside, reinforcing smart money control.
Source: CryptoQuant
However, as the market peaked, whale activity declined while retail orders expanded toward $2,000–$3,000. This shift shows whales distributing their assets into strength, using rising retail demand as exit liquidity. As this dynamic unfolded, price strength weakened and transitioned into broader downside pressure through 2022.
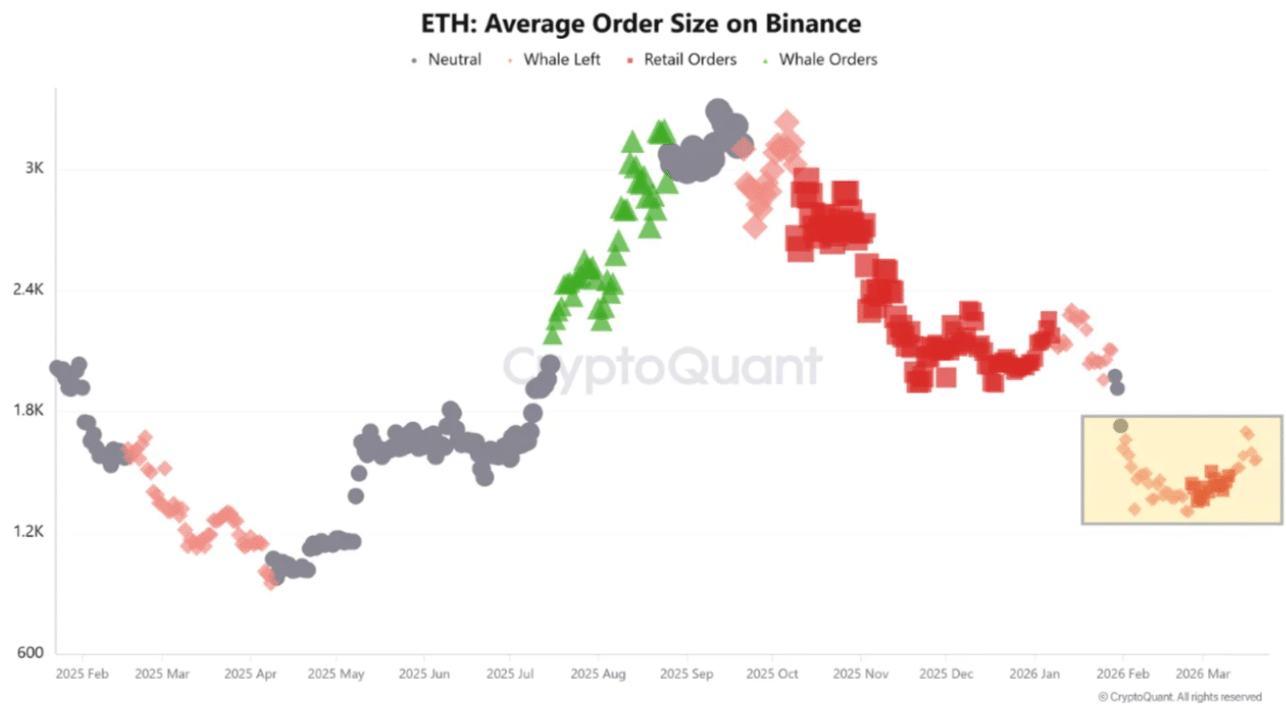
Into 2023, both whale and retail orders compressed between $1,000 and $1,500, reflecting exhaustion and aligning with a base formation. From there, recovery attempts emerged, yet whale participation stayed muted.
Source: CryptoQuant
Now, retail orders are rising again toward $1,600–$2,000, signaling dip-buying. Whales, on the other hand, do not move, indicating a lack of conviction. As a result, the market leans on fragile demand, increasing the risk of failed breakouts or slow distribution rather than sustained expansion.
Ethereum structure tilts as whale inactivity meets retail-led absorption
At press time, Ethereum Exchange Reserves climbed to 15.86 million ETH, rising only 0.1% in 24 hours, which remains marginal. At the same time, net inflows reached 17,994 ETH on the 19th of March, indicating steady movement onto exchanges. This suggests whales are stepping back, not quietly exiting, since 1,000+ and 10,000 transactions show no spike.
Meanwhile, retail activity is increasing, with higher spot and futures frequency as smaller orders absorb supply. In parallel, Funding Rates hovered near 0.0010%, showing demand is not driven by excessive leverage.
On one hand, this controlled flow avoids panic selling and supports price stability as retail builds a base. On the other hand, reduced whale participation weakens momentum, leaving the market reliant on smaller players.
As this divergence continues, Ethereum faces a balanced setup where stability holds, yet breakout strength remains uncertain without renewed large-holder conviction.
At the time of writing, Ethereum traded between $2,153 and $2,158, where the rally reflects steady spot-driven demand rather than leveraged buildup. Perpetual Open Interest held near $28.8–$29 billion, while a 1.3% decline signaled mild deleveraging instead of aggressive positioning.
Meanwhile, Spot Taker CVD trended upward, indicating consistent buying on dips, while perpetual CVD remained flatter, lacking strong speculative follow-through. In parallel, the basis stays tight, keeping Futures aligned with spots and limiting distortion.
On one hand, this structure supports stability, as liquidations around $33 million reduce cascade risk. On the other hand, muted derivatives participation caps momentum. As this balance holds, Ethereum trends steadily, yet stronger upside depends on renewed conviction beyond retail-driven spot demand.
Final Summary
Ethereum shifts to retail-led demand as whales step back, sustaining price but weakening structure and raising the risk of range-bound moves or failed breakouts.
ETH rally remains spot-driven with muted leverage, supporting stability but limiting momentum, leaving upside dependent on renewed broader participation.
Trading in financial instruments and cryptocurrencies carries significant risks, including the potential loss of some or all of your investment. Such activities may not be suitable for all investors. Cryptocurrency prices are highly volatile and can be influenced by various external factors, including financial, regulatory, and political events. Additionally, trading on margin heightens financial risks.
Before you decide to trade in financial instruments or cryptocurrencies, it is essential to fully understand the associated risks and costs. Consider your investment objectives, experience level, and risk tolerance, and seek professional advice if necessary.
Please note that the data on this website may not always be real-time or accurate. The information and prices provided may not originate from any specific market or exchange; instead, they may come from market makers. As such, prices are indicative and may differ from actual market prices, making them unsuitable for trading purposes. Fusion Media and any data providers associated with this website disclaim any liability for losses or damages arising from your trading activities or reliance on the information provided here.
Unauthorized use, storage, reproduction, display, modification, transmission, or distribution of the data on this website is prohibited without explicit prior written consent from Fusion Media or the data provider. All intellectual property rights are retained by the data providers and/or the exchanges that supply the data featured on this website.
Fusion Media may receive compensation from advertisers appearing on the site based on your interactions with those advertisements.