


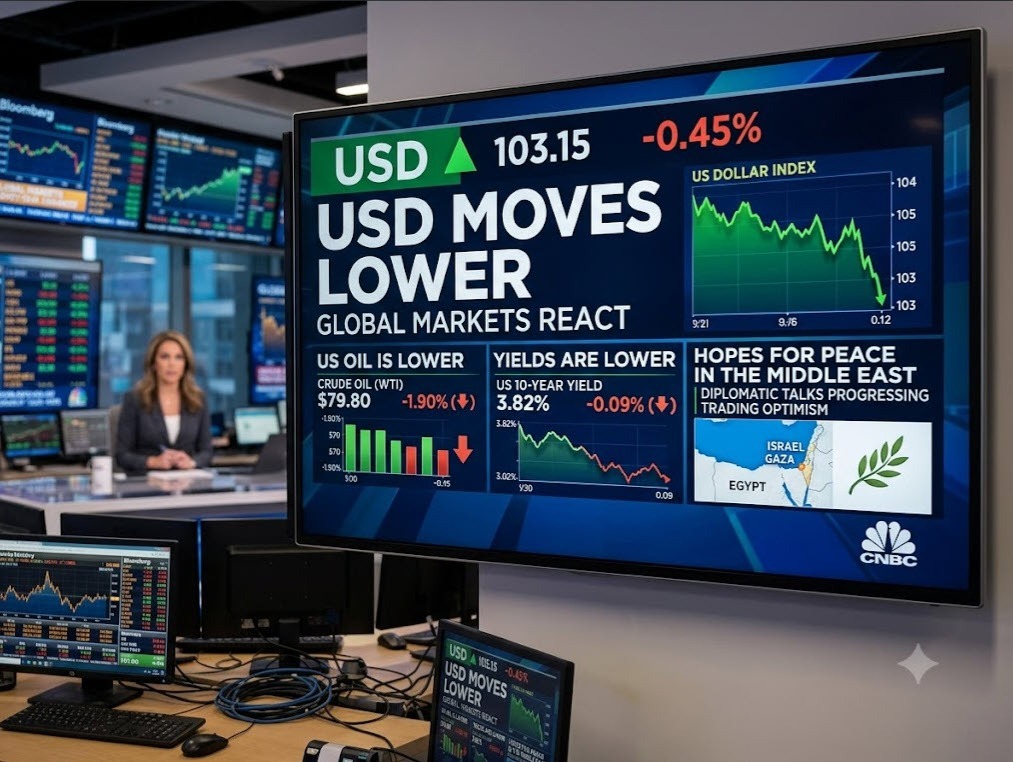

The stock market has staged an impressive reversal, with the Nasdaq erasing a loss of more than 350 points and turning positive. The index is now up 20 points at 24,952. The Dow Industrial Average has climbed 656 points, or 1.26%, while the S&P 500 is higher by 30 points, or 0.42%.
European equities finished the session with a mixed tone, as gains in the region’s core markets were offset by weakness in Southern Europe.
- EURO STOXX 50: 25,464.02, +102.98 points (+0.41%)
- France (CAC 40): 8,458.79, +52.72 points (+0.63%)
- U.K. (FTSE 100): 10,871.01, +89.25 points (+0.83%)
- Spain (IBEX 35): 19,727.00, -14.30 points (-0.07%)
- Italy (FTSE MIB): 51,698.18, -356.78 points (-0.69%)
Overall, European markets leaned modestly higher, led by strong performances in the FTSE 100 and CAC 40, while the EURO STOXX 50 also posted a solid gain. In contrast, Spain’s IBEX 35 finished little changed, and Italy’s FTSE MIB underperformed with the day’s largest decline, leaving the region with a mixed but generally constructive close.
Meanwhile, crude oil has extended its decline, falling back below the $80.00 level and moving into an important technical support zone between $77.00 and $79.18, an area defined by prior swing highs and lows. A sustained break below that region would shift focus toward the 200-day moving average at $75.36. For now, the price is testing that key support area (see chart below).
Looking at the USD, the greenback is heading back to the downside.
EURUSD: The EURUSD has climbed back above its 100-hour moving average at 1.1387 and is now testing the next key technical hurdle at the 200-hour moving average (1.14065). A sustained break above that level would strengthen the bullish bias and shift the focus toward a series of recent swing highs at 1.1419, 1.1435, and 1.1450. Holding above the 200-hour moving average would give buyers greater control in the short term.
USDJPY: The USDJPY rallied to within a few pips of last week’s 40-year high at 163.98, reaching 163.94 before running into willing sellers and rotating lower. The pullback has the pair approaching its rising 100-hour moving average at 163.604, a level that proved pivotal yesterday when buyers leaned against it and sparked a rebound.
If sellers can push the price below the 100-hour moving average, the focus shifts to yesterday’s low at 163.325. A break below that level would target the July 21 swing high at 163.245, followed by the 200-hour moving average at 163.093. Those levels will be key in determining whether the current pullback develops into a deeper correction or simply provides another buying opportunity.
GBPUSD: The GBPUSD has pushed back above the 1.3298–1.3304 resistance zone, shifting the focus to the next key upside target: the falling 100-hour moving average at 1.33286. That moving average capped rallies on two separate occasions yesterday, reinforcing its importance as near-term resistance.
A sustained move above the 100-hour moving average would strengthen the bullish bias and open the door for a test of the 1.33406 swing level, followed by the 50% midpoint of the trading range from the June low at 1.33483. Those levels represent the next key hurdles if buyers are to build on today’s recovery.


