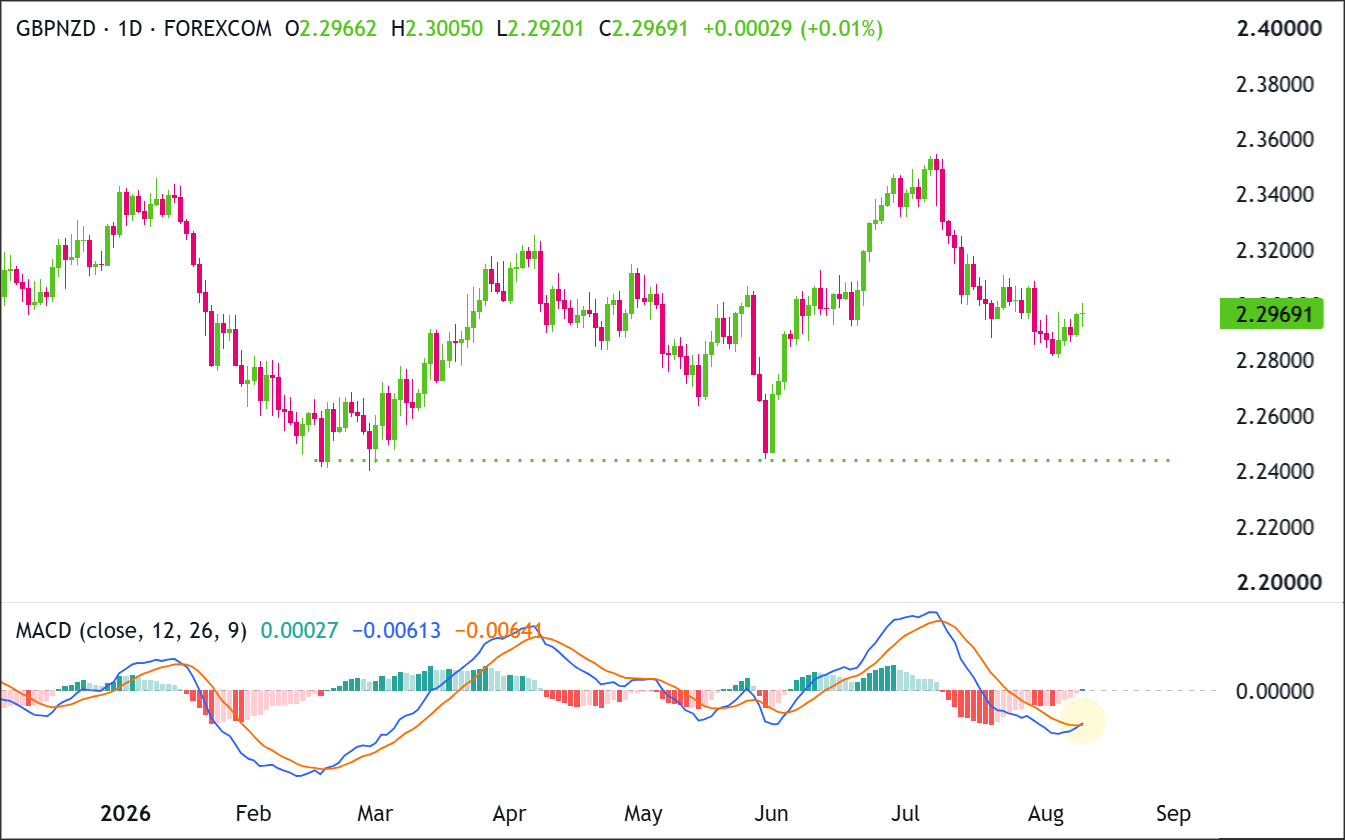



GBP/NZD is showing early signs of stabilization after its sharp July pullback, with the latest downswing forming a higher swing low and price beginning to recover.
Momentum is also improving as the MACD line crosses above the signal line, suggesting selling pressure may be starting to fade.
The key question now is whether buyers can build on this shift and extend the rebound, or whether the recovery will lose momentum and leave the pair vulnerable to another move lower.
Welcome to “TA Alert of the Day.” Each day after the market close, MarketMilk scans for popular technical indicator alerts. We use these alerts as the basis for a mini-lesson, breaking down what each alert means, why it matters, and how traders might interpret it. The goal is to help beginner traders not only spot these alerts but also understand the logic behind them and how they can inform trading decisions.
What MarketMilk Has Detected
MarketMilk detected a bullish MACD crossover on the daily chart, with the MACD line moving above its signal line.
While both lines remain below zero, the crossover indicates that downside momentum has been easing and short-term momentum is improving versus the recent trend.
What This Signals
A MACD bullish crossover suggests that upside momentum is beginning to build and can attract trend-following interest, particularly if price holds above nearby support and follow-through buying appears.
If the move is sustained, traders often look for a transition from “bounce” behavior into a more durable upswing, especially when the histogram turns positive as it has here.
However, this same pattern can also represent a counter-trend bounce rather than a full trend reversal.
When the MACD crossover occurs below the zero line, it sometimes coincides with prices briefly lifting into resistance before sellers reassert control, creating a “pop-and-fade” type of failure.
In that scenario, the 2.295–2.300 zone can act as an overhead cap rather than a breakout launchpad.
The outcome depends heavily on follow-through price action, where the crossover occurs relative to key support/resistance, and broader trend context on higher timeframes.
How It Works
The MACD (Moving Average Convergence Divergence) compares two exponential moving averages (typically 12 and 26 periods) to measure momentum, then plots a signal line (typically a 9-period EMA of the MACD).
A bullish signal occurs when the MACD line crosses above the signal line, indicating the faster average is improving relative to the slower average.
Because MACD is derived from moving averages, it is inherently lagging: it often confirms a momentum shift after price has already started turning.
Traders tend to treat crossovers as a “momentum confirmation” tool rather than a stand-alone entry trigger.
Important: Crossovers that happen below the zero line can be earlier but less definitive, and they may be more vulnerable to false starts if price is still capped by resistance. Reliability often improves when the crossover is accompanied by a clear break of structure (e.g., higher highs/higher lows) or when MACD later reclaims the zero line.
What to Look For Before Acting
Do not assume this crossover means a sustained uptrend is underway. Consider these factors:
✅ Whether GBP/NZD can hold above 2.295 on daily closes (a recent pivot area)
✅ A clean push through 2.300–2.306, which has repeatedly acted as a congestion/resistance zone
✅ Evidence of a higher low forming above the early-August support area near 2.282
✅ MACD histogram staying positive for multiple sessions (reduced whipsaw risk)
✅ Whether price structure shifts into higher highs on the daily chart (not just a single bounce)
✅ Confirmation on the Weekly timeframe (trend bias and whether the pullback is stabilizing)
✅ Reactions around prior swing zones: 2.288–2.290 as near-term support and 2.319–2.330 as a higher resistance band from June highs
✅ Volatility/range expansion after the signal (MACD improves in trending conditions)
✅ Macro catalysts for GBP and NZD (rate expectations, inflation/employment data, and broad risk sentiment)
Risk Considerations
⚠️ Whipsaw risk if GBP/NZD remains range-bound around 2.29–2.30
⚠️ The crossover is below zero, which can indicate the move is still corrective within a broader downswing
⚠️ A failure back below 2.295 can quickly flip sentiment and negate the momentum improvement
⚠️ Resistance overhead near 2.300–2.306 may trigger sell reactions before any trend develops
⚠️ Event-driven volatility (central bank messaging/data surprises) can override indicator-based setups
Potential Next Steps
Consider placing GBP/NZD on a watchlist as the pair attempts to recover from its recent pullback and establish a firmer short-term base.
The next stretch of price action should help determine whether this rebound can develop into a broader recovery or whether sellers regain control and resume the decline.
Technical Analysis
GBP/NZD is attempting to recover after the July decline.
MACD remains below the zero line, but momentum is improving: the MACD line has crossed above the signal line and the histogram has turned positive, supporting the possibility of a continued rebound.
Price has bounced from the recent swing low around 2.2820 and is beginning to print a sequence of stronger daily candles.
That low also represents a higher low relative to the major June swing low near 2.2440, suggesting sellers have not yet broken the broader recovery structure.
Buyers now need to push through 2.3050–2.3100 to confirm stronger upside follow-through, while a break back below 2.2800 would weaken the higher-low setup and put sellers back in control.
Trade Idea: Bullish Continuation Scenario
Setup
The bullish setup depends on GBP/NZD holding the recent higher-low zone at 2.2800–2.2850 and extending its rebound through nearby resistance.
The improving MACD crossover supports the recovery attempt, but price still needs to clear 2.3050–2.3100 before the move has stronger technical confirmation.
A successful breakout could reopen the path toward the prior July swing-high region at 2.3400–2.3500.
Entry
Consider entering long on a daily close above 2.3100, confirming that buyers are breaking out of the recent structure.
Alternatively, enter on a controlled pullback into 2.2850–2.2900 if price stabilizes there and turns back higher.
If price loses that support zone and closes decisively below 2.2800, stand aside and wait for either deeper support to form or a cleaner breakout later.
Stop Loss
For breakout entries: stop on a daily close back below 2.3000. That would invalidate the breakout by showing price could not stay above the former ceiling.
For pullback entries: stop on a daily close below 2.2800. That would invalidate the support-hold idea and show buyers are no longer defending the zone.
Take Profit
Target 2.3500, because that is the next clear upside area on the chart and the most natural place for price to retest if the current recovery continues.
Bottom Line
The bullish case is strengthening as GBP/NZD rebounds from a higher swing low and MACD crosses above its signal line.
A daily close above 2.3100 would provide stronger confirmation that the rebound is developing into a broader recovery, with 2.3400–2.3500 becoming the primary upside target.
The setup remains constructive while 2.2800–2.2850 holds. A decisive daily close below 2.2800 would invalidate the higher-low thesis and weaken the bullish continuation case.
Trade Idea: Bearish Pullback Scenario
Setup
The bearish setup becomes more attractive if the current rebound stalls around 2.3050–2.3100 and sellers reassert control.
Despite the bullish MACD crossover, the indicator remains below the zero line, so the broader momentum backdrop has not fully turned bullish.
Sellers would gain stronger confirmation if price breaks beneath the recent higher-low support around 2.2800–2.2850.
Entry
Consider entering short on a daily close below 2.2800, confirming that the support zone has failed.
Alternatively, if price pushes into 2.3050–2.3100 and prints a clear bearish rejection candle, enter short on the next daily close back below 2.3000.
If price instead breaks and closes decisively above 2.3100, stand aside, as that would invalidate the bearish pullback idea.
Stop Loss
For breakdown entries: stop on a daily close back above 2.2850. That would invalidate the breakdown by showing price has reclaimed the support zone.
For rejection entries near resistance: stop on a daily close above 2.3100. That would invalidate the bearish idea by confirming buyers have pushed through resistance.
Take Profit
Target 2.2440, because that is the next major support area below the current structure and the most likely place where buyers would try to step back in.
Bottom Line
The bearish case requires the rebound to fail beneath 2.3050–2.3100 and, more importantly, for price to break below 2.2800. That would erase the recent higher-low structure and indicate that sellers are regaining control.
A confirmed breakdown below 2.2800 would place 2.2440 back in focus as the major downside target. A daily close above 2.3100 would invalidate the bearish pullback setup by confirming that resistance has been overcome.
This content is strictly for informational purposes only and does not constitute as investment advice. Trading any financial market involves risk. Please read our Risk Disclosure to make sure you understand the risks involved.