




BUILDon [B] rallied over the past few days, bringing a possible breakout into focus. Its Cup and Handle Pattern pointed toward $0.26 and $0.31, but buying pressure offered a mixed signal.
The first test was the pattern’s neckline resistance. A candle close above that level, backed by strong buying volume, could bring both targets into play.
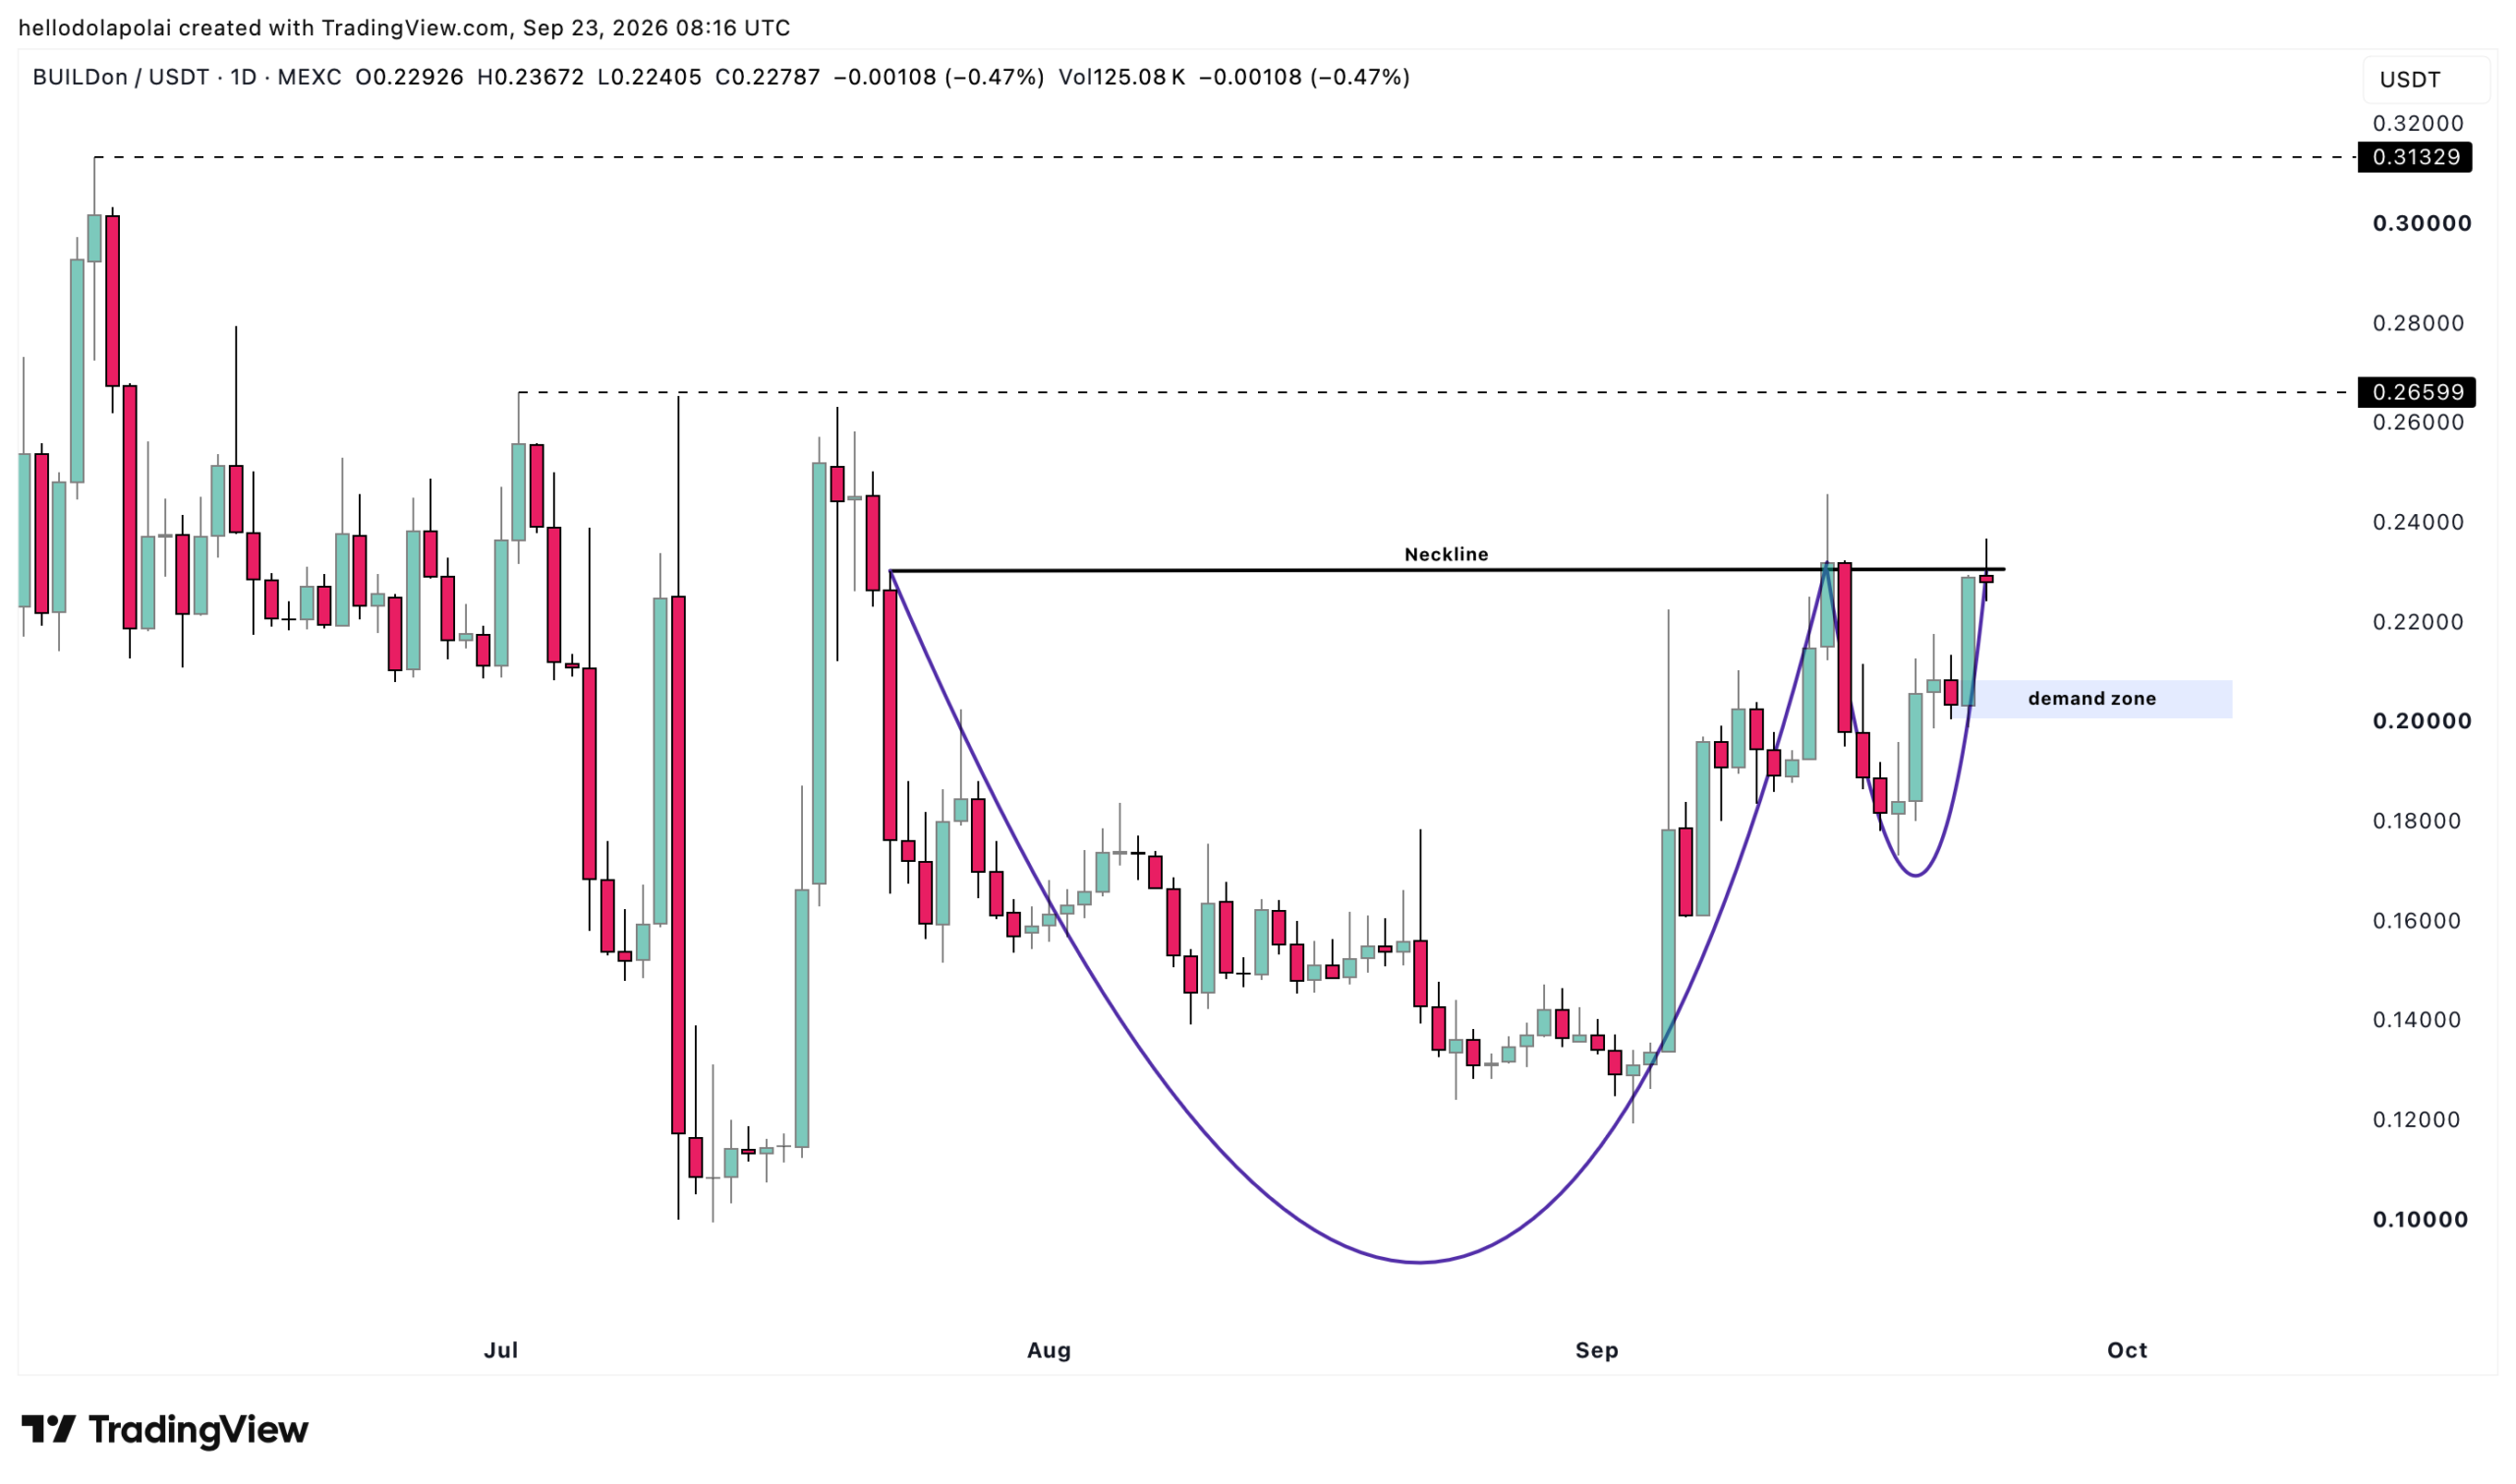
Can BUILDon break its resistance?
Bull Bear Power supported the bullish case. Its green histogram reached its highest level since the 14th of September, suggesting buyers had gained strength.
However, Chaikin Money Flow [CMF] told a less convincing story. The indicator fell below zero, pointing to selling pressure despite B’s rally.
That split raised the question behind the breakout setup: could buyers sustain a move above resistance?
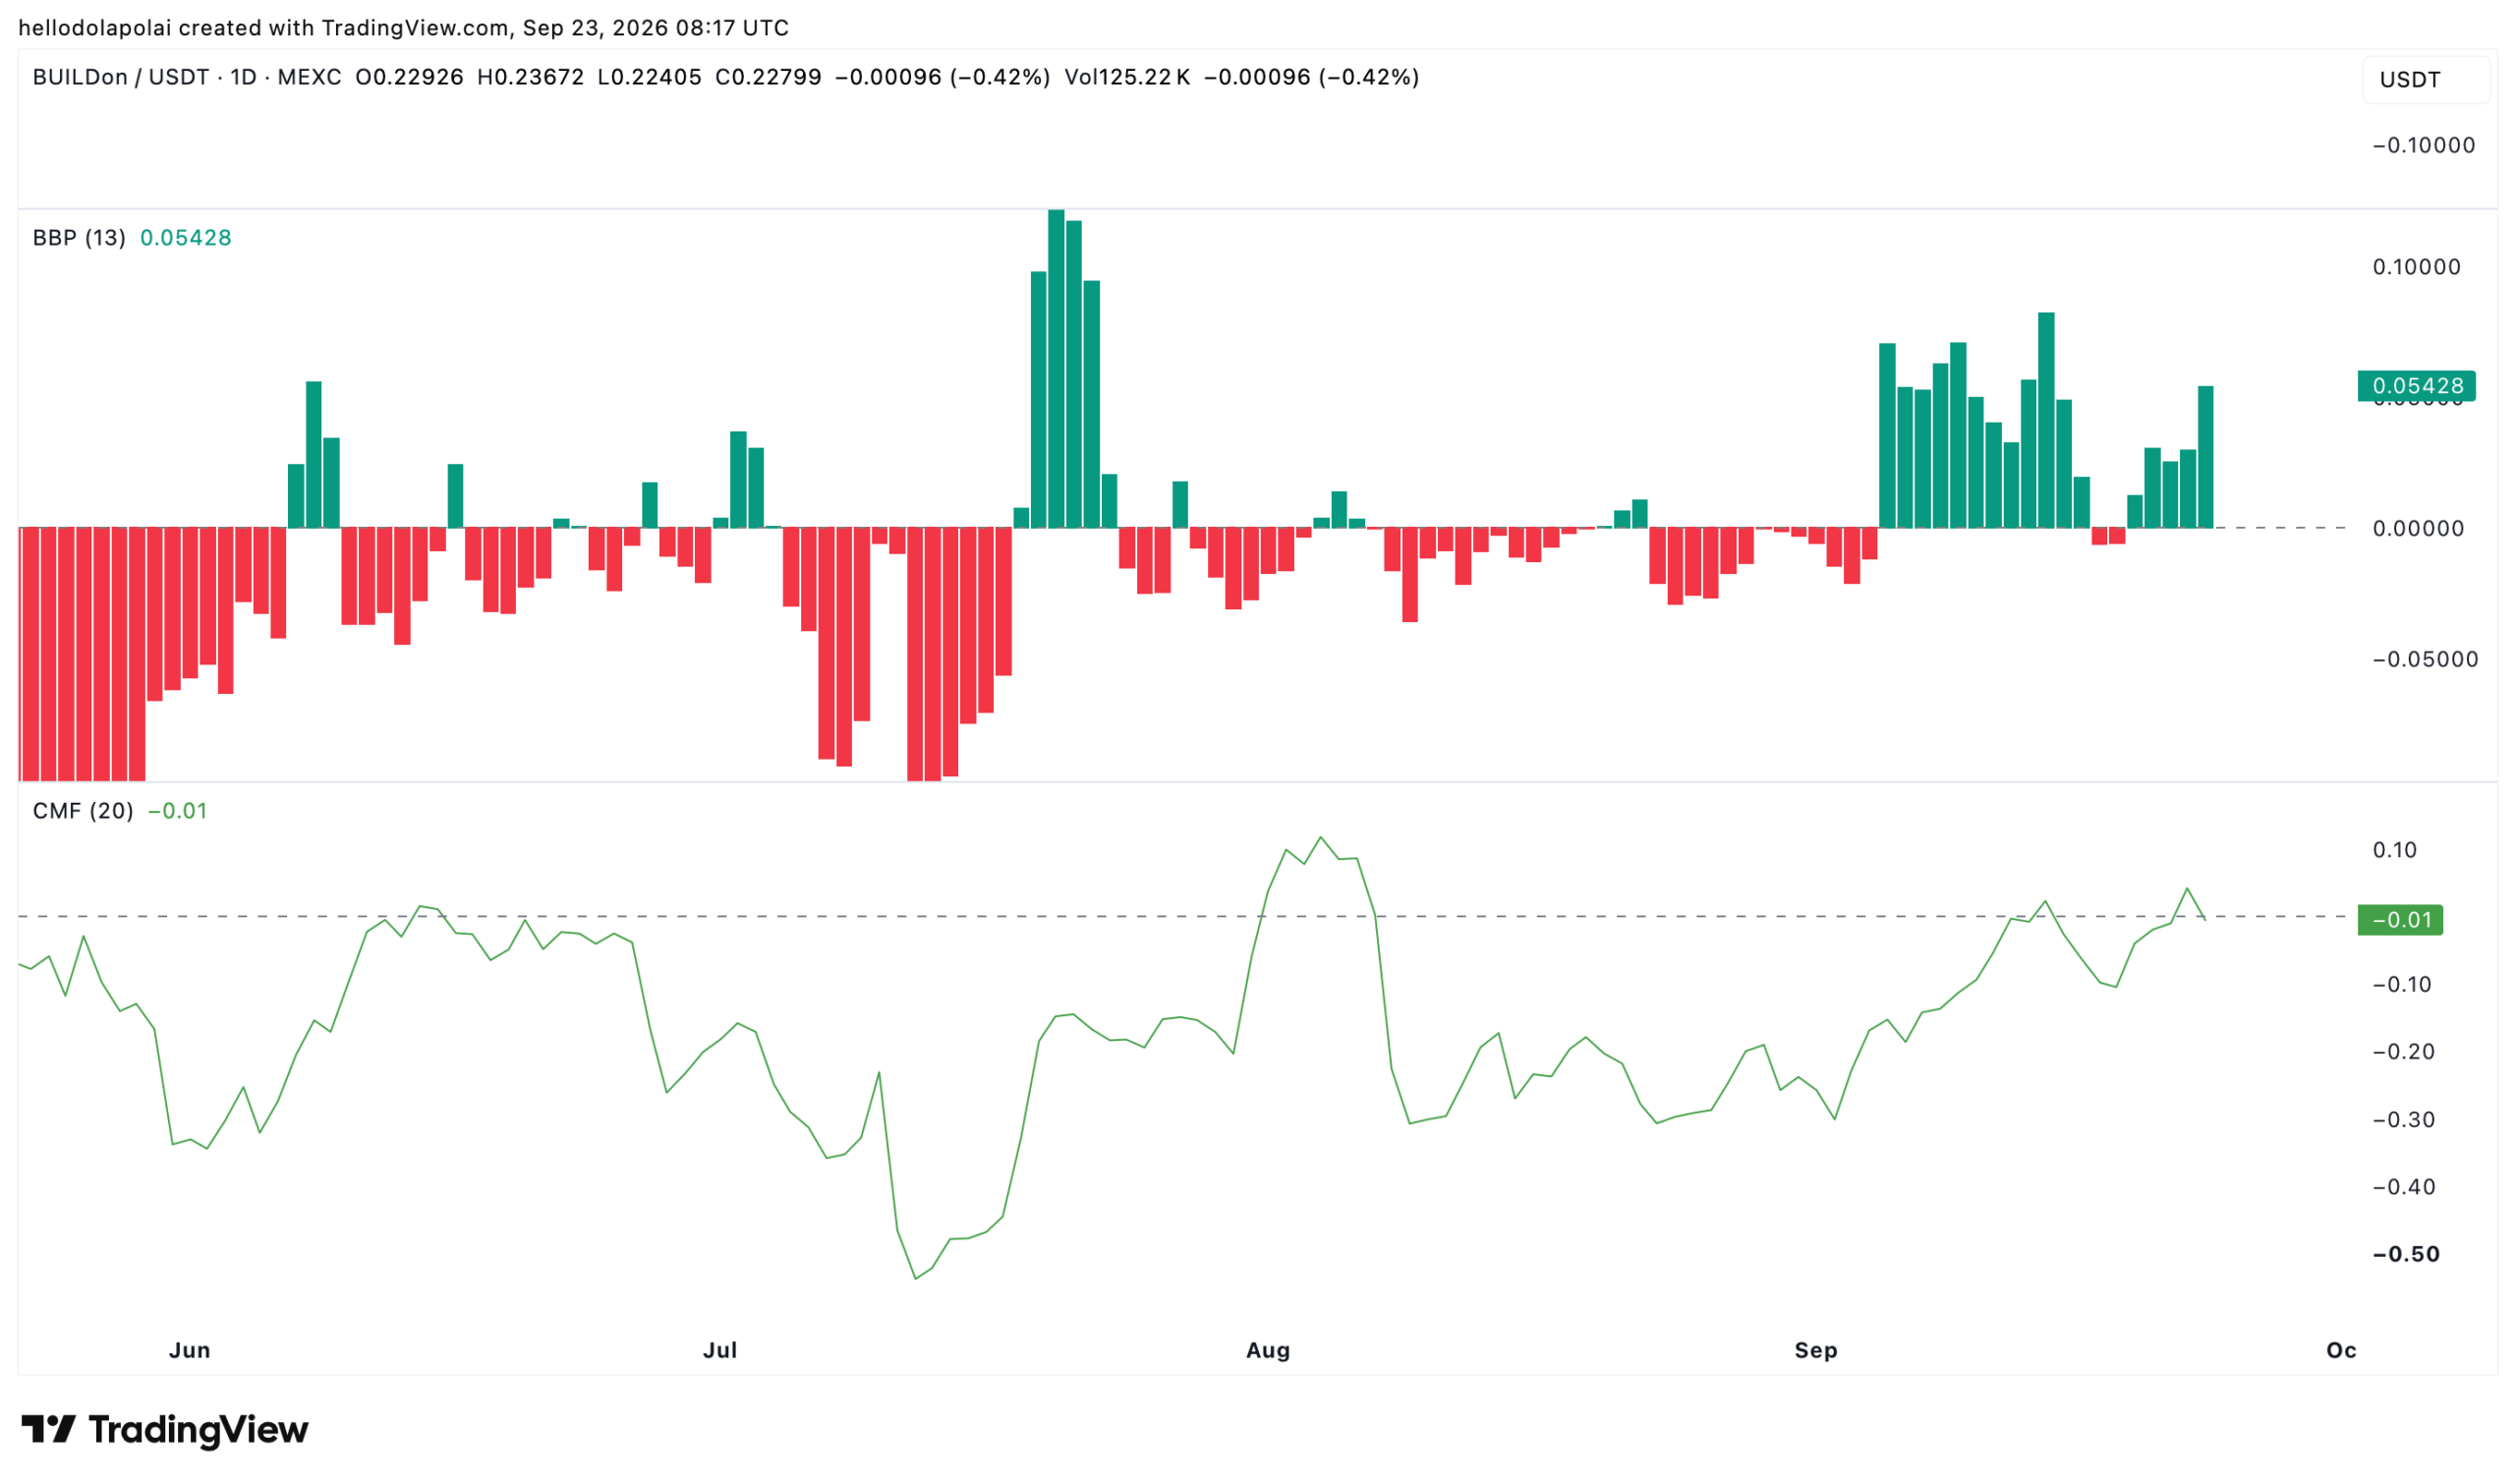
Where could B price move next?
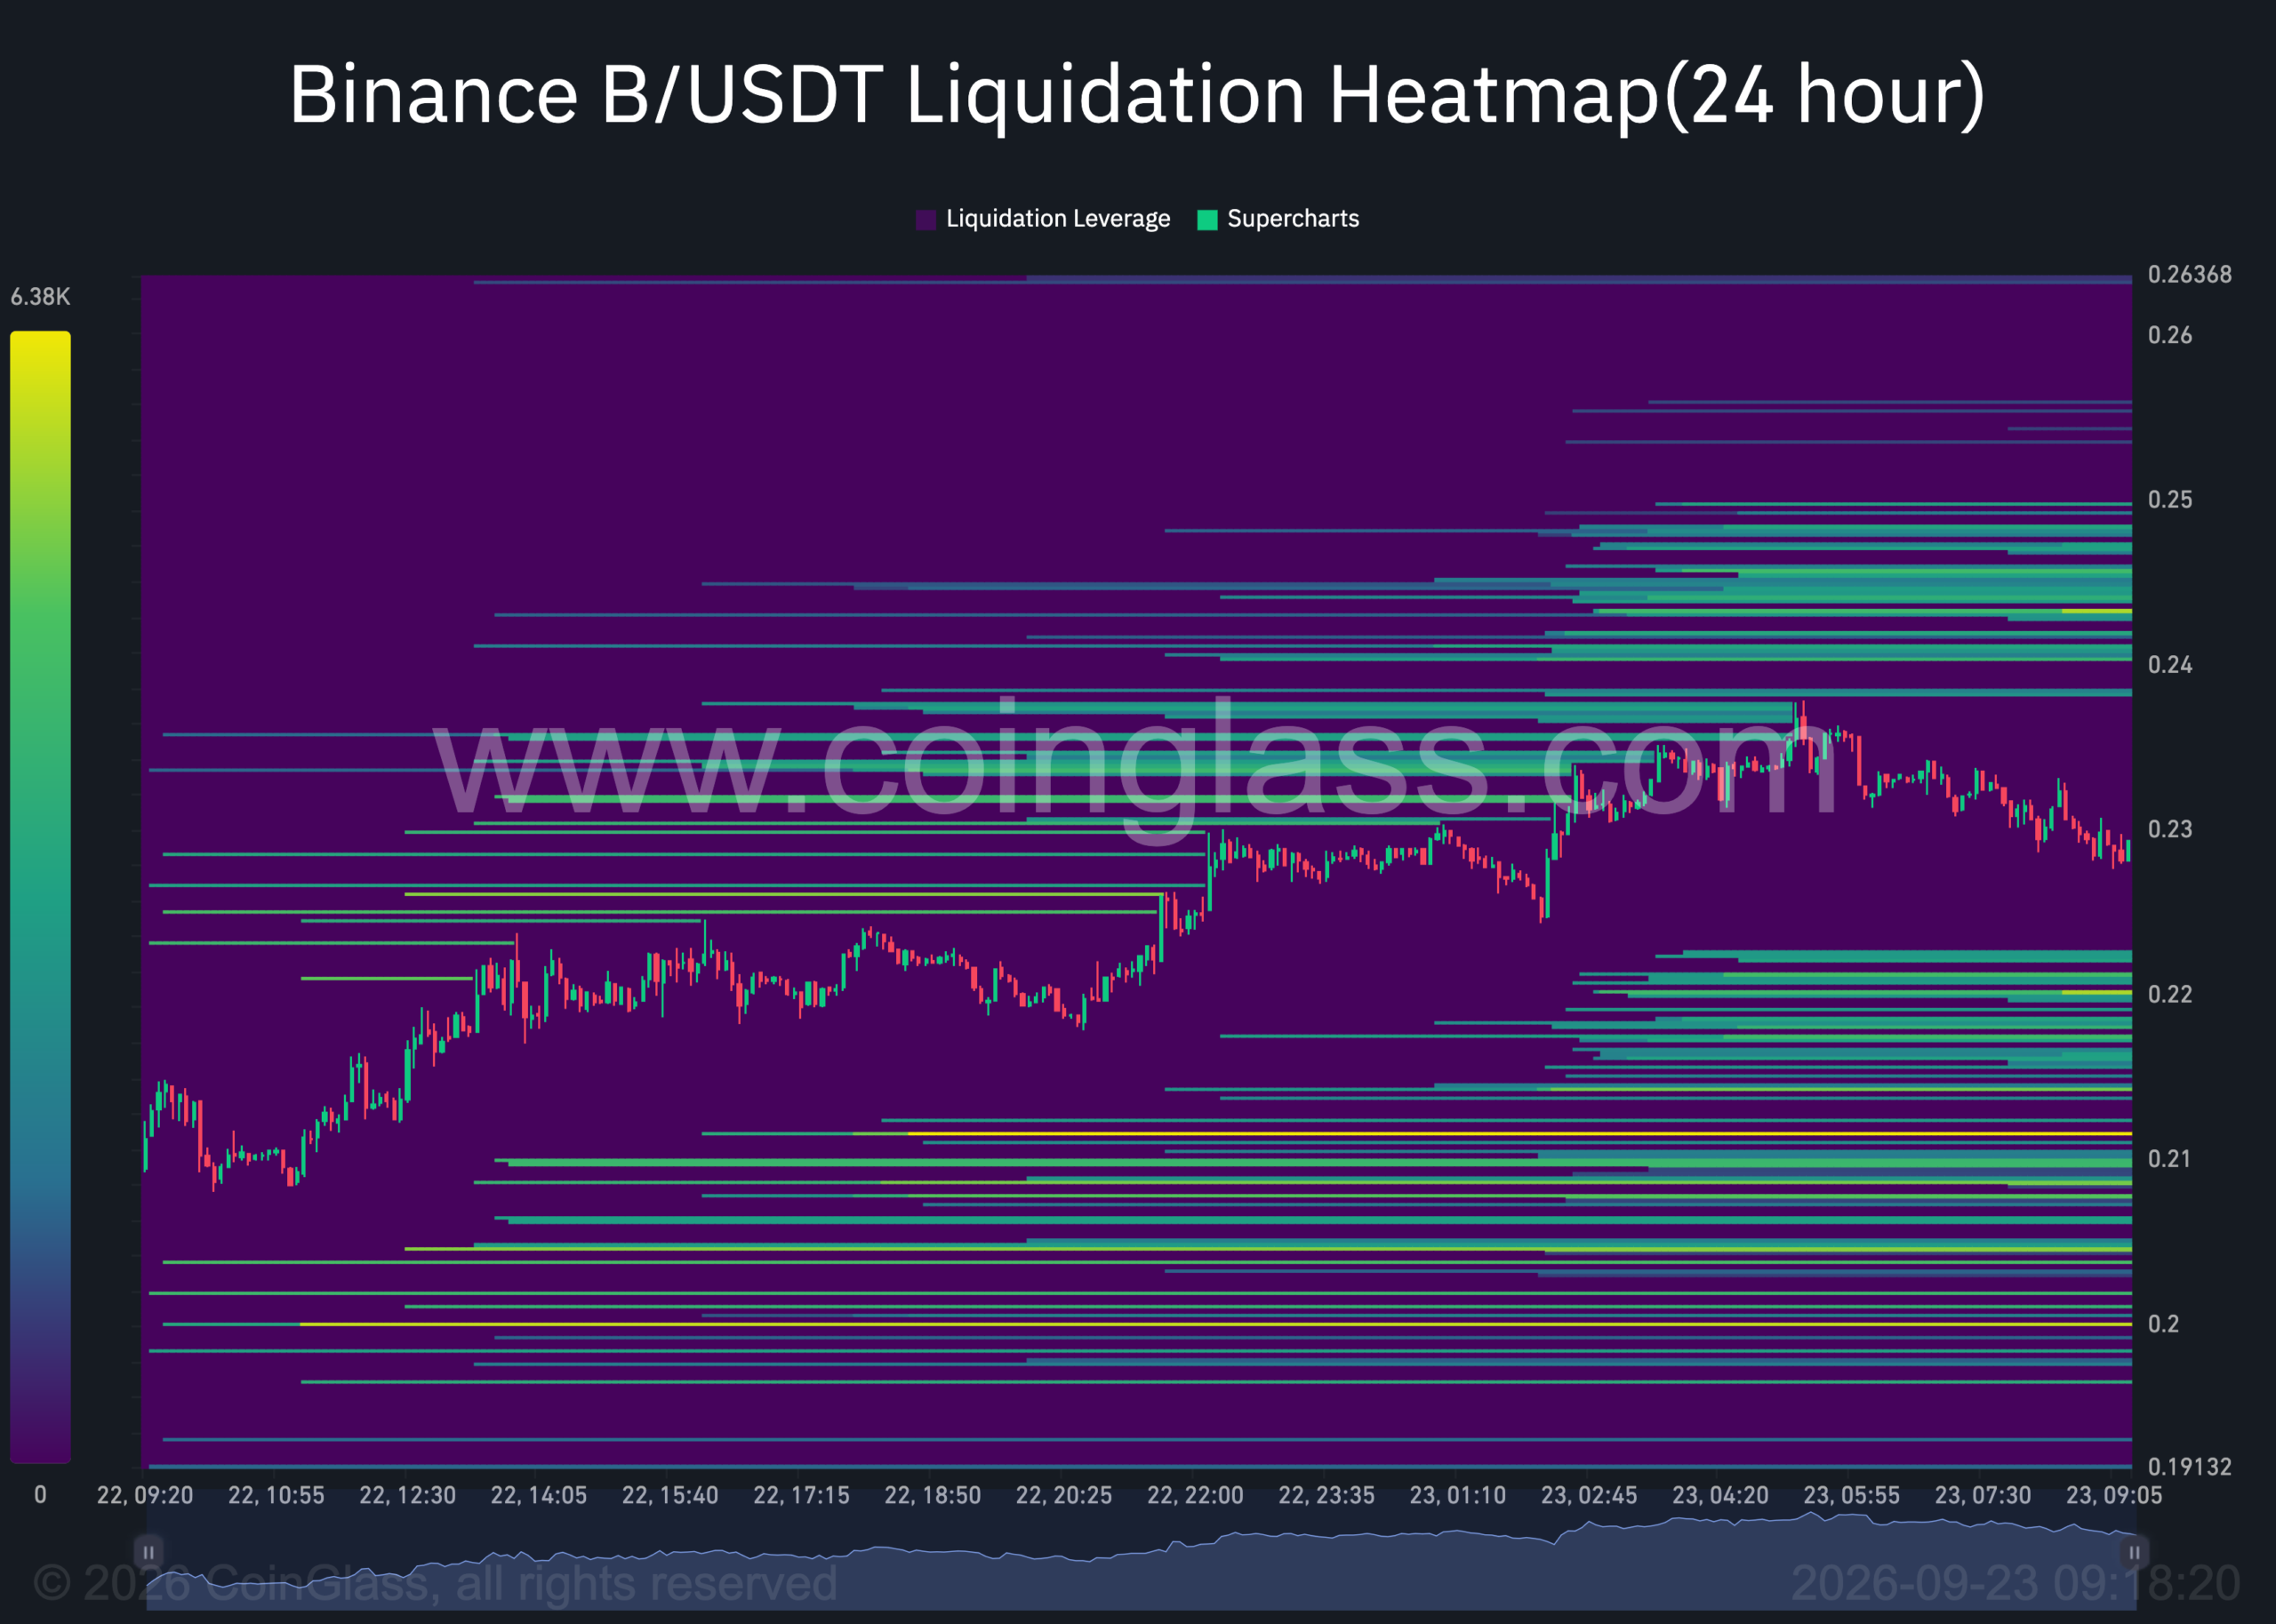
The Liquidation Heatmap showed clusters above and below B’s price. Those levels could attract price as leveraged positions faced liquidation.
A move toward the lower cluster could come before another attempt at resistance. Still, the heatmap alone could not establish which cluster price would reach first.
For now, the bullish pattern kept $0.26 and $0.31 in view for BUILDon [B]. A convincing breakout would require buying volume to support the move, especially while CMF remained negative.
Final Summary
- BUILDon’s Cup and Handle Pattern pointed to $0.26 and $0.31 if B broke neckline resistance.
- Bull Bear Power strengthened, suggesting buyers had gained ground during the rally.


