


Tuesday’s session was defined by a convergence of forces that sent U.S. Treasury yields climbing toward multi-year highs and lifted the dollar to its best single-session performance among the major currencies. With WTI crude oil holding comfortably above $100 per barrel, the Iran conflict showing no signs of resolution, and resilient U.S. economic data keeping Federal Reserve rate hike speculation firmly in play, risk appetite deteriorated through much of the day. Equities extended their recent losing streak while gold pulled back sharply, and the dollar drew broad-based support as the session’s standout performer.
Check out the forex news and economic updates you may have missed in the latest trading session!
Forex News Headlines & Data:
- New Zealand Electronic Card Retail Sales for April 2026: 2.0% y/y (3.4% y/y forecast; 2.7% y/y previous)
- Japan GDP Growth Rate Prel for Q1 2026: 2.1% y/y (1.5% y/y forecast; 1.3% y/y previous)
- Japan GDP Price Index for Q1 2026: 3.4% y/y (3.0% y/y forecast; 3.4% y/y previous)
- RBA Meeting Minutes (4 and 5 May 2026): eight of nine Monetary Policy Board members supported the 25 basis point rate hike to 4.35%, with one member preferring to wait for more data. The Board viewed the increase as necessary to manage inflation expectations amid rising fuel prices from the Middle East conflict, while providing flexibility to assess the economic impact and household responses to the ongoing geopolitical situation.
- Australia Westpac Consumer Confidence Change for May 2026: 3.5% (-1.1% forecast; -12.5% previous)
- Japan Industrial Production Final for March 2026: -0.4% m/m (-0.5% m/m forecast; -2.0% m/m previous)
-
U.K. Employment Change for March 2026: 148.0k (95.0k forecast; 25.0k previous)
- U.K. Unemployment Rate for March 2026: 5.0% (4.9% forecast; 4.9% previous)
- U.K. Claimant Count Change for April 2026: 26.5k (32.0k forecast; 26.8k previous)
- U.S. ADP Employment Change Weekly for May 2, 2026: 42.25k (33.0k previous)
- Canada Building Permits for March 2026: 10.3% m/m (3.8% m/m forecast; -8.4% m/m previous)
- Canada New Housing Price Index for April 2026: -0.4% m/m (-0.1% m/m forecast; -0.2% m/m previous)
- Canada CPI Growth Rate for April 2026: 2.8% y/y (3.0% y/y forecast; 2.4% y/y previous); 0.4% m/m (0.7% m/m forecast; 0.9% m/m previous)
- U.S. Pending Home Sales for April 2026: 3.2% y/y (-0.5% y/y forecast; -1.1% y/y previous)
- New Zealand Global Dairy Trade Price Index for May 19, 2026: 0.6% (1.5% previous)
Promoted: Day traders & Scalpers have better odds of making great decisions if they see market catalysts right away. Get the real-time feed that pros use to catch the news.
Join FinancialJuice for Free to learn more!
Disclosure: We may earn a commission from our partners if you sign up through our links, at no extra cost to you.
Broad Market Price Action:
Dollar Index, Gold, Oil, S&P 500, U.S. 10-yr Yield, Bitcoin Overlay – Chart Faster With TradingView
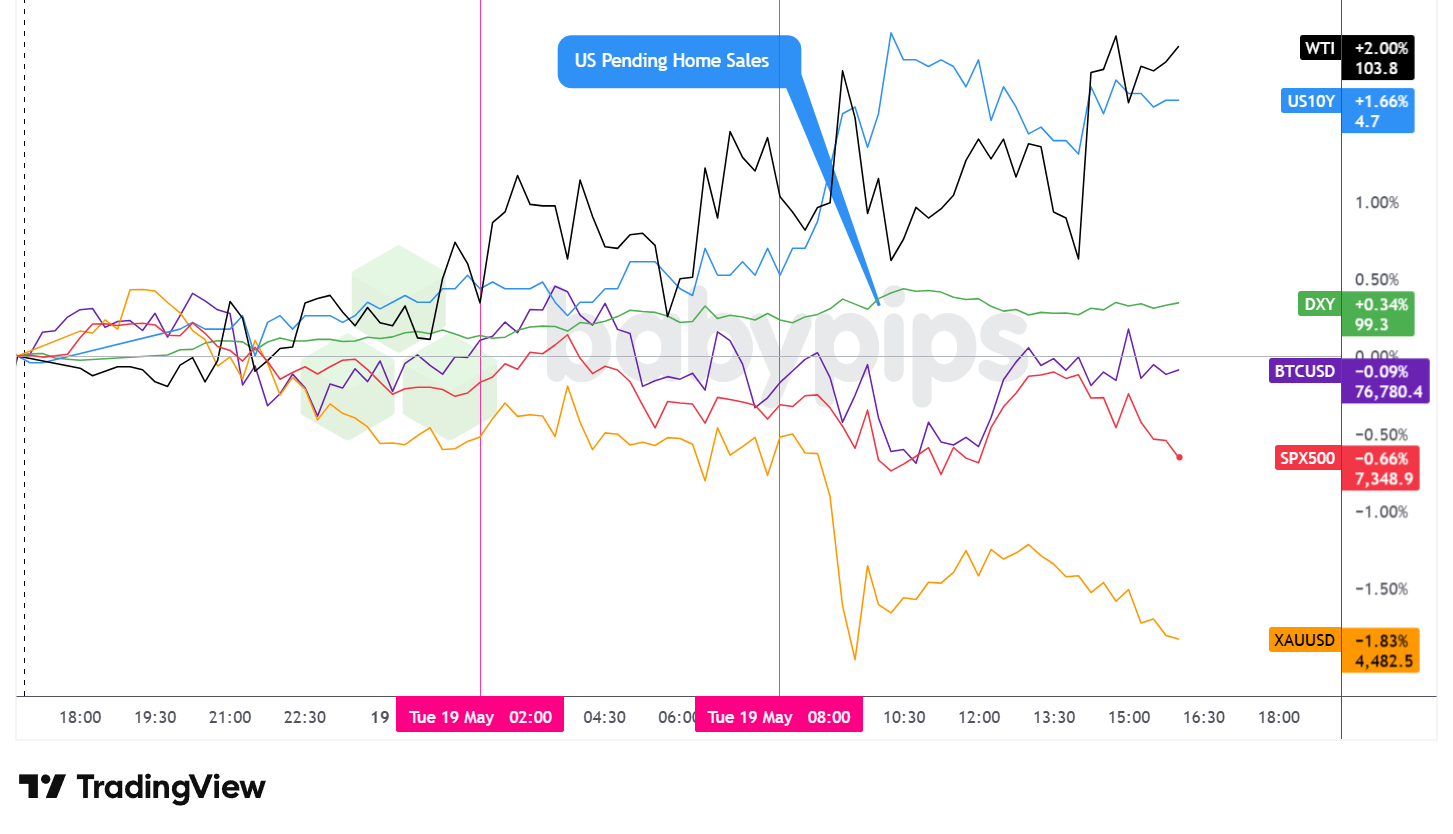
The session’s most consequential move was in the bond market, where rising yields put pressure on risk assets across the board and reinforced the dollar’s outperformance on the day.
The U.S. 10-year Treasury yield rose approximately 1.66% on the day to trade around 4.70%, touching levels not seen in years as bond markets priced in a growing probability that elevated energy-driven inflation could push the Federal Reserve toward rate hikes rather than cuts. The 30-year yields separately reached their highest levels since 2007 during the session, with the broader narrative centered on oil holding above $100 and the Iran conflict providing no near-term relief on the inflation front.
The S&P 500 closed down approximately 0.66%, settling near 7,348.9, extending the index’s longest losing streak since the end of March. The benchmark equity index drifted lower through much of the U.S. session against the headwinds of rising bond yields and Fed rate hike speculation. A partial rebound in semiconductor stocks provided some mid-session stabilization, though it was insufficient to reverse the broader trend lower. Nvidia’s earnings, due after Wednesday’s closing bell, were widely cited as a key near-term catalyst for the sector and broader market sentiment.
WTI crude oil was the session’s strongest performer, rising approximately 2.00% to trade near $103.80 per barrel. Oil remained comfortably above $100 per barrel, supported by the ongoing Hormuz disruption. Trump’s threat to resume strikes on Iran may have added an additional geopolitical risk premium through the session, though a direct causal link cannot be confirmed.
Gold pulled back sharply, declining approximately 1.83% to trade near $4,482.50 per ounce. The precious metal came under sustained selling pressure beginning around the London-to-U.S. session transition and continued lower through the afternoon. The magnitude of the move likely reflected, at least in part, the competing attraction of rising nominal Treasury yields pulling capital away from non-yielding assets, though no single identifiable catalyst directly explains the full extent of the decline.
Bitcoin traded roughly flat on the session, edging down approximately 0.09% to trade near $76,780. The cryptocurrency oscillated in a comparatively contained range relative to the more directional moves elsewhere, showing little decisive reaction to the macro crosscurrents dominating the session.
Promotion: If your confidence has grown in your market awareness & strategies with this market recap, and you wanna take action, Maven Trading can help. They provide simulated funding challenges starting as low as $15, allowing you to trade major pairs with professional-sized capital. No time limits mean you can take swing plays on these market themes without the pressure of a ticking clock.
Learn More About Maven Trading Today!
Disclosure: We may earn a commission from our partners if you sign up through our links, at no extra cost to you.
FX Market Behavior: U.S. Dollar vs. Majors
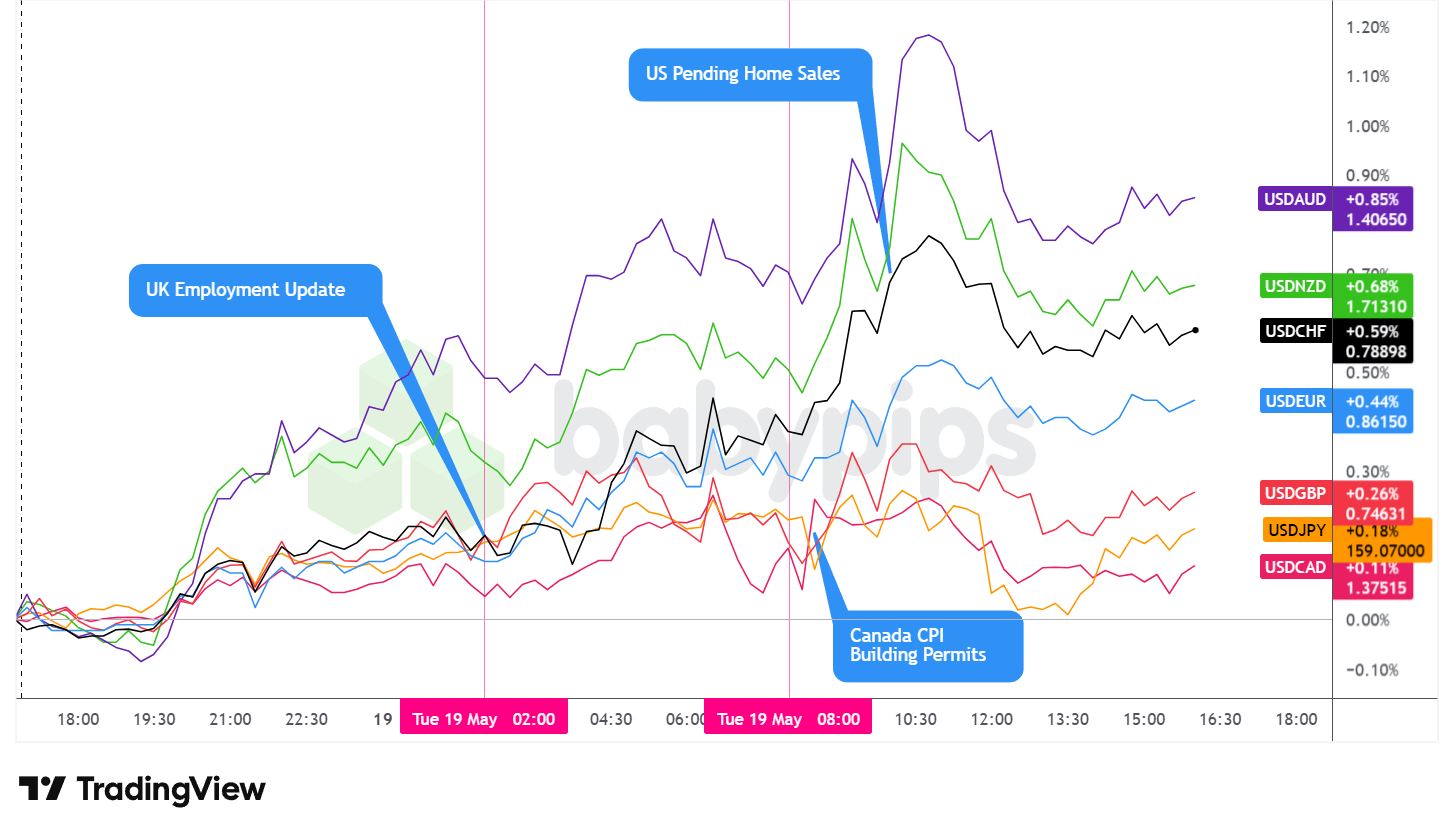
Overlay of USD vs. Majors – Chart Faster With TradingView
The U.S. dollar closed Tuesday as the best-performing major currency, extending gains broadly as a combination of elevated Treasury yields, persistent Middle East geopolitical uncertainty, resilient U.S. economic data, and growing Fed rate hike speculation provided underlying support for the greenback throughout the session.
During the Asian session, the dollar traded with a steady bullish lean, gradually reclaiming Monday’s losses as AUD, NZD, GBP, and JPY all retreated. USD/JPY pushed toward 159, staying within range of the 160 level Japanese authorities have flagged as a potential intervention trigger. Japan’s Q1 GDP beat at 2.1% annualized versus a 1.5% forecast offered initial support for risk assets, though the Nikkei failed to hold early gains, with analysts noting the energy shock’s full impact on growth won’t be visible until Q2 data. The RBA minutes confirmed eight of nine board members backed the hike to 4.35%, with language widely read as leaving June open as a possible pause while keeping August live.
The London session was anchored by the UK jobs report, which leaned softer on balance. The unemployment rate ticked to 5.0% against a 4.9% forecast, and a provisional April payroll decline of 100,000 drew attention, though the ONS flagged the estimate as subject to larger-than-usual revisions given the tax-year timing, a caution broadly echoed by analysts. The March employment change beat at 148,000 versus 95,000 expected, adding to the mixed picture. The overall data suggested a labor market in gradual retreat without delivering a clean dovish signal, and the dollar continued trending higher as yield and geopolitical dynamics dominated flows.
The U.S. session brought Canada’s broadly softer-than-expected CPI suite alongside U.S. pending home sales. Canada’s headline CPI came in at 2.8% year-on-year versus a 3.0% forecast, with core measures undershooting across the board — the Trimmed-Mean at 2.0% and Median at 2.1% both running well below their 2.3% forecasts, suggesting underlying price pressures may be cooling faster than anticipated.
U.S. pending home sales came in slightly below the monthly forecast at 1.4%, though the year-on-year reading of 3.2% beat expectations significantly. The dollar extended gains through much of the session, peaking near the London close before pulling back modestly and stabilizing into the afternoon.
Promoted: The Strategy is Half the Battle; Your Mindset is the Rest.
In “Unknown Market Wizards,” (⭐ 4.6★ | 1,400+ reviews on Amazon) Jack Schwager interviews successful traders to reveal a common truth: their edge isn’t just knowledge or skills—it’s their psychological resilience and rigid risk control. Whether you’re navigating shifting geopolitical themes or top tier economic data, learn how the “wizards” stay clinical when the rest of the market is emotional.
Master Your Trading Mindset with Market Wizards!
Disclosure: We may earn a commission from our partners if you sign up through our links, at no extra cost to you.
Upcoming Potential Catalysts on the Economic Calendar
- U.S. API Crude Oil Stock Change for May 15, 2026 at 8:30 pm GMT
- U.S. Fed Paulson Speech at 11:00 pm GMT
- Japan Reuters Tankan Index for May 2026 at 12:00 am GMT
- Australia Westpac Leading Index for April 2026
- Germany PPI for April 2026 at 6:00 am GMT
- U.K. Inflation Growth Rates for April 2026 at 6:00 am GMT
- China FDI (YTD) YoY for April 2026
- Euro area CPI Growth Rate Final for April 2026 at 9:00 am GMT
- U.S. MBA 30-Year Mortgage Rate for May 15, 2026 at 11:00 am GMT
- U.S. MBA Mortgage Applications for May 15, 2026 at 11:00 am GMT
- U.S. Fed Paulson Speech at 12:00 pm GMT
- U.S. Fed Barr Speech at 2:15 pm GMT
- U.S. EIA Crude Oil Stocks Change for May 15, 2026 at 2:30 pm GMT
- U.S. FOMC Minutes at 6:00 pm GMT
Wednesday’s calendar is headlined by the U.K. April inflation print at 6:00 am GMT, which will be the most closely watched release of the session for forex traders. With the Bank of England holding rates at 3.75% while balancing a weakening labor market against energy-driven price pressure from the Iran conflict, any surprise in either direction could meaningfully shift BOE rate expectations and move sterling.
The eurozone CPI final for April at 9:00 am GMT follows shortly after and will be scanned for any revision to preliminary readings.
The FOMC Minutes at 6:00 pm GMT round out the day as the session’s highest-impact U.S. event, with markets likely to parse the language closely for any signals on how seriously policymakers are weighing the possibility of resuming rate hikes in response to the energy shock.
On the oil side, the API crude stock change estimate arrives in the evening before the official EIA inventory data the following afternoon at 2:30 pm GMT.
Fed speeches from Paulson and Barr during the U.S. session may also draw attention given the current sensitivity around rate policy messaging. Nvidia’s earnings after Wednesday’s closing bell add an additional layer of event risk for equity and risk sentiment more broadly.
Stay frosty out there, forex friends!
Tuesday’s session showed exactly how the bond market, equity indices, oil prices, and geopolitical risk all moved together to shape currency flows. But most traders watch these markets separately, missing the connections that predicted the dollar’s move before it happened. Premium members can read our lesson:
📖 What Is Intermarket Analysis?
Reading this helps you understand how Treasury yields affect currency movements, why rising bond yields supported the dollar while pressuring equities and gold, and how to read stocks, bonds, commodities, and currencies together so you see the full picture before placing any trade.
And if you’re not a Premium subscriber yet, now’s a good time to sign up.
With Babypips Premium, you get full access to School of Pipsology lessons that help you understand not just how individual markets move, but how they drive each other and shape currency flows before price action even appears on your chart.