


After a sharp dip, EUR/CAD looks ready to extend a weeks-long uptrend!
Will the 38.2% Fib, Pivot Point, and 100 SMA be enough to hold the bulls’ ground?
Here’s what we’re seeing on the 4-hour time frame:
EUR/CAD 4-hour Forex Chart Faster with TradingView
Earlier this week, ECB President Lagarde kept things measured during her appearance before the European Parliament’s ECON Committee. She acknowledged that Euro Area inflation still needs watching, but stopped short of hinting at any urgent policy shift. That kept the euro supported, but not enough to spark a clean directional move.
Canada’s May CPI, meanwhile, came in hotter than expected at 3.2% y/y versus the 2.9% forecast. Normally, that kind of surprise could give the Loonie a solid lift. But with WTI crude sliding after US-Iran diplomatic progress, CAD may struggle to fully cash in on the hawkish inflation print ahead of Governor Macklem’s Tuesday speech.
Remember that directional biases and volatility conditions in market price are typically driven by fundamentals. If you haven’t yet done your homework on the euro and the Canadian dollar, then it’s time to check out the economic calendar and stay updated on daily fundamental news!
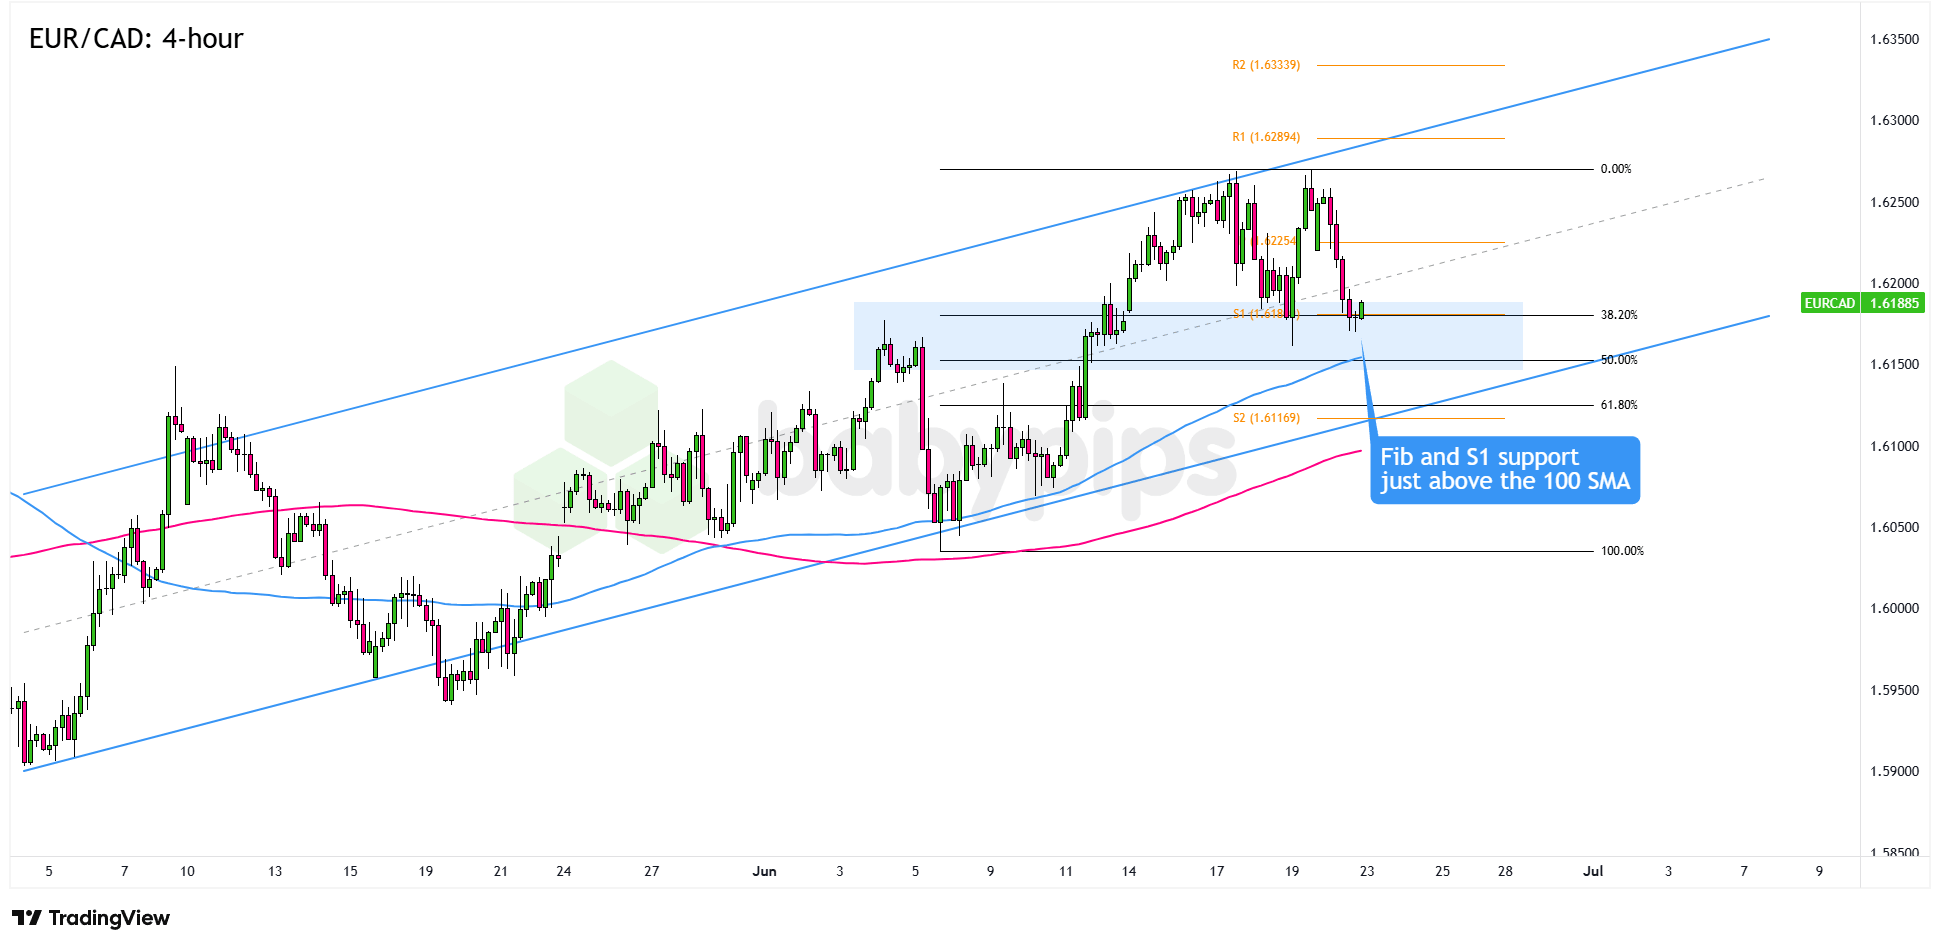
EUR/CAD has been climbing inside an ascending channel pattern on the 4-hour chart since early May, and the latest pullback from the 1.6180 area has brought price into a key support zone.
See, price currently aligns with the 38.2% Fibonacci retracement, the S1 Pivot Point, AND the 100 SMA support near the middle of the channel, giving bulls a potential floor to defend. As long as price holds this area, the broader uptrend could remain in play.
A confirmed bounce from the 38.2% Fib and S1 support zone could put the 1.6260 swing high back on the radar, followed by the R1 pivot at 1.6289. If bullish momentum really gets cooking, EUR/CAD could even make a run at R2 near 1.6334.
On the other hand, a break below the 100 SMA and the 38.2% Fib cluster would weaken the bullish case. That could open the door for a deeper pullback toward the 50% Fibonacci retracement and the S2 Pivot Point level at 1.6117.
Whichever bias you end up trading, don’t forget to practice proper risk management and stay aware of top-tier catalysts that could influence overall market sentiment!
This EUR/CAD chart is making a case for support based on three technical factors converging at the same level: the 38.2% Fib, S1 Pivot, and 100 SMA. Premium members can read our lesson:
📖 Confluence: Stacking the Odds in Your Favor
Reading this helps you understand how to score a price action setup before you take it, why multiple factors pointing at the same level changes the quality of the trade, and how to apply this thinking to every chart you read.
And if you’re not a Premium subscriber yet, now’s a good time to sign up.
With Babypips Premium, you get full access to School of Pipsology lessons that help you understand not just which technical levels to watch, but why certain setups carry more weight than others.