




This preview of weekly data examines USOIL and XAUUSD, with economic data expected later this week as the primary market drivers of the near-term outlook.
Highlights of the week: US services PMI and job report, Canadian unemployment
Wednesday
US Services PMI at 14:00 GMT where the consensus is for an increase from 54 points to 54.5. This might be rather bullish news for the Dollar since it would mean that the services sector in the States is still expanding given that the actual figure will also be above the 50 point mark.
Thursday
Australian Balance of trade at 13:30 GMT where the expectations are for an increase reaching A$1.1 billion in trade deficit. This might not have a significant effect on the Aussie Dollar since the data are for the month of June and might already have been priced in.
Friday
Chinese Balance of trade at 03:00 AM GMT where the figure for July is expected to decrease from $125.62 Billion to $108 Billion. If this is broadly accurate then it might create some losses for the currency in the immediate aftermath of the release.
Canadian unemployment rate at 12:30 GMT. The market is expecting the figure to remain stable at 6.5% for July. However, any significant deviation from the expected figure will most likely create volatility on all loonie pairs.
US Job report at 12:30 GMT where the non-farm payrolls and unemployment rate are going to be published. The expectation for the NFP is for a slight increase to reach 83,000 against the previous recording of 57,000. If these expectations are correct, the dollar could move up in various pairs in the aftermath of the release. On the other hand, the unemployment rate is expected to increase from 4.2% to 4.3%.
USOil, daily
Oil prices fell after US President Donald Trump said new talks with Iran would begin following his decision to cancel a planned military strike, easing concerns over further escalation in the Middle East. The decline reflected reduced geopolitical risk, although prices are unlikely to remain lower without an agreement that restores normal shipping through the Strait of Hormuz. Markets remain cautious after a reported explosion near a tanker off Oman highlighted ongoing risks to maritime trade. Meanwhile, OPEC+ approved another modest production increase, while Gulf producers continued seeking alternative export routes to reduce reliance on vulnerable shipping lanes.
From a technical perspective, crude oil has come under renewed selling pressure after failing to sustain its rally above $90, with price retreating toward the 50% Fibonacci retracement at $79.30, which is acting as immediate support. The decline has pushed price back around the 50-day SMA, while it remains below the 100-day SMA, keeping the broader outlook tilted to the downside. The Stochastic oscillator has fallen into oversold territory, suggesting bearish momentum may be fading and increasing the likelihood of a short-term rebound. Meanwhile, the Bollinger Bands have started to narrow after the recent surge in volatility, indicating that price swings may begin to moderate. A sustained break below $79.30 could expose the 61.8% Fibonacci support at $76.60, while a recovery above the 38.2% Fibonacci level at $82 would improve the near-term technical outlook.
Gold-Dollar, daily
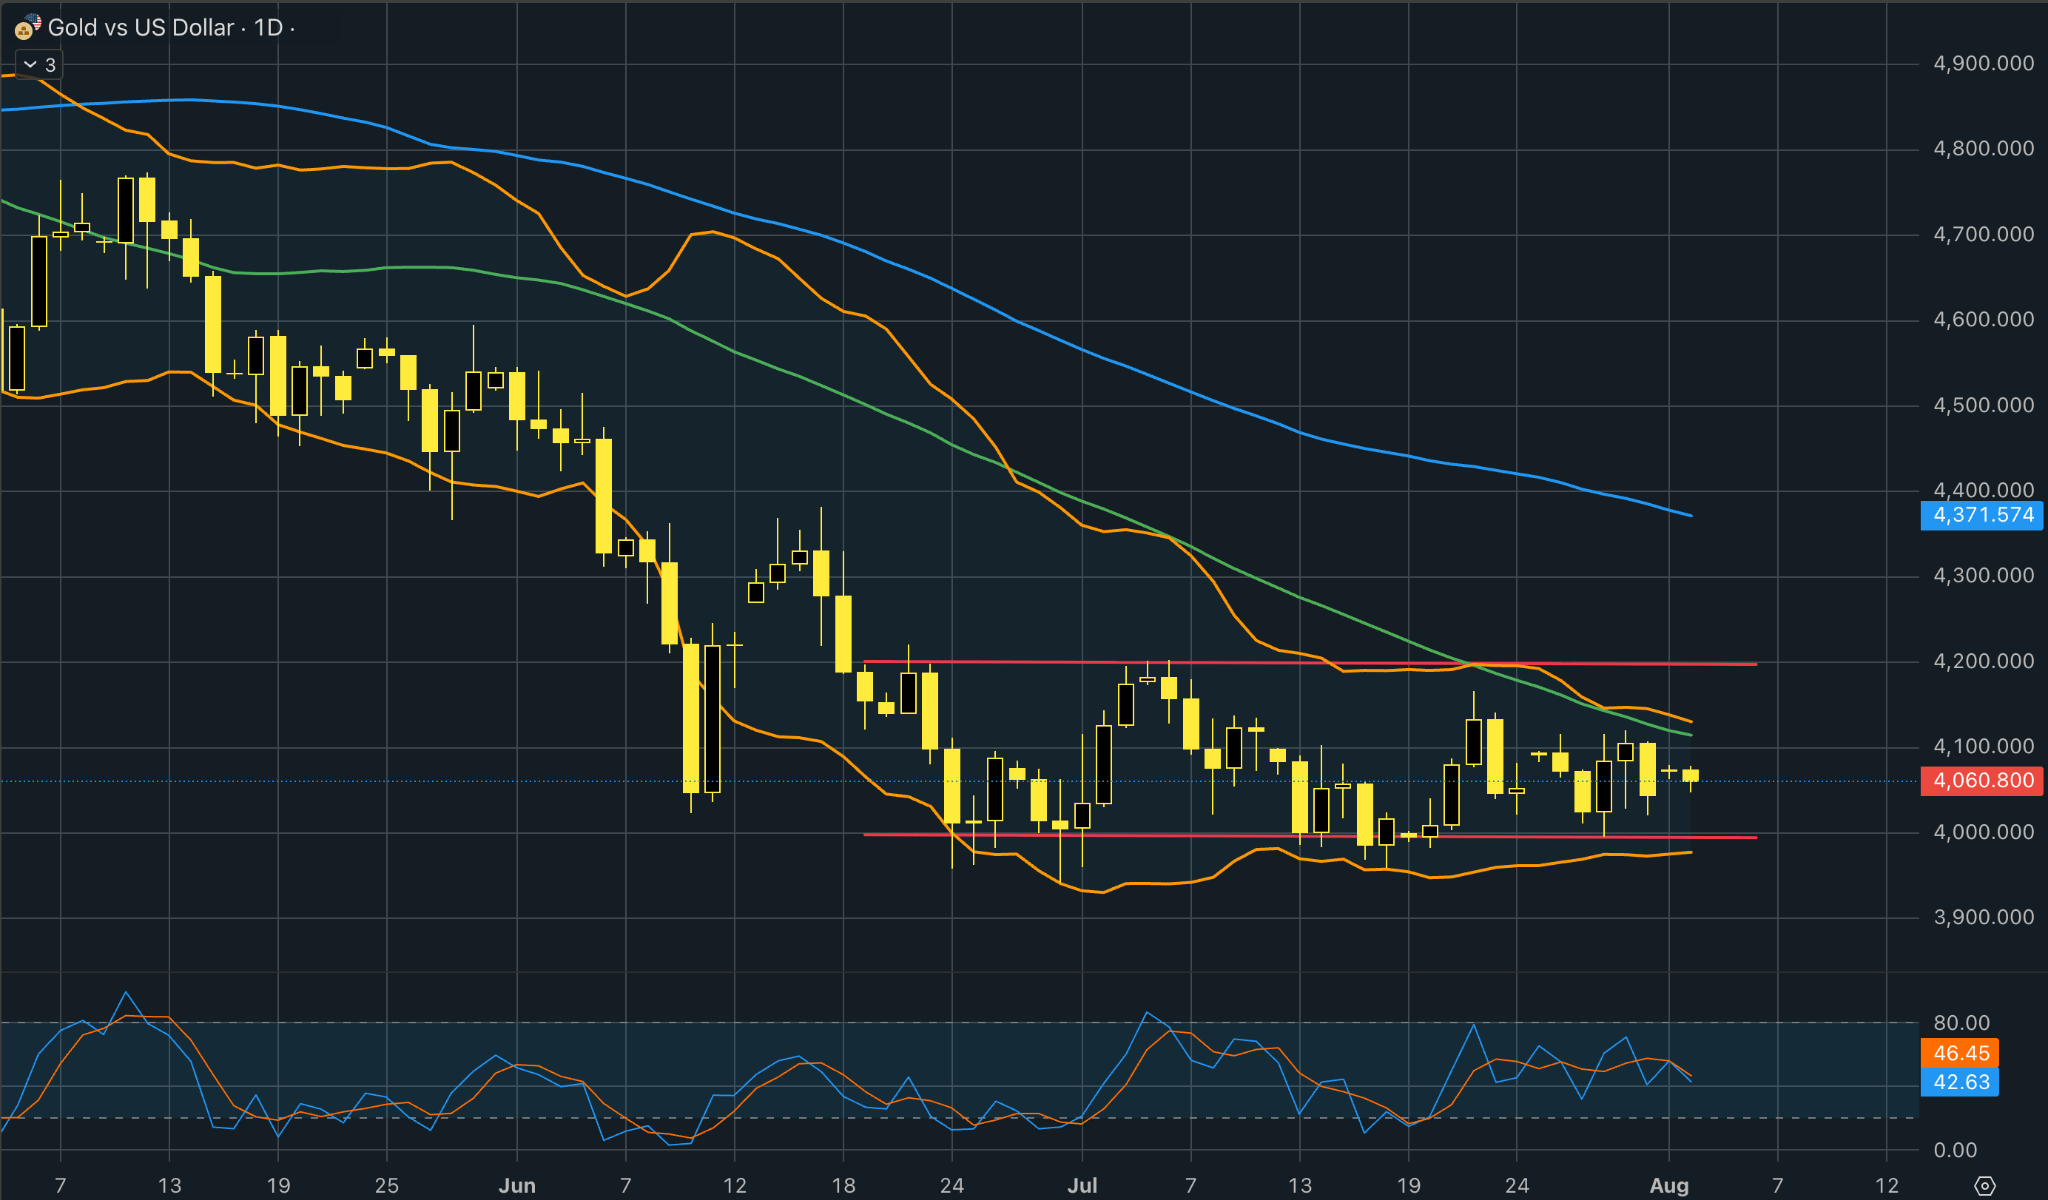
Gold edged higher after US President Donald Trump announced fresh talks with Iran, boosting hopes for a diplomatic resolution that could ease energy-driven inflation pressures. The precious metal also found support following last week’s Federal Reserve meeting, although rising bond yields and expectations that interest rates may stay higher for longer continued to limit gains. Investors remain focused on developments in the Middle East and the Fed’s policy outlook, with analysts expecting geopolitical progress to be the key driver of gold’s next move.
From a technical point of view, gold continues to trade below both the 50-day and 100-day SMAs, keeping the broader trend tilted to the downside. However, price action has stabilised over the past few weeks, with gold consolidating between the $4,000 support and $4,200 resistance levels. The Bollinger Bands have narrowed, reflecting lower volatility and hinting that a breakout may be approaching. Meanwhile, the Stochastic oscillator is moving around the midpoint, indicating balanced momentum and the absence of a clear directional bias. A decisive break above $4,200 could pave the way for a recovery toward the 100-day SMA, while a drop below $4,000 would likely reinforce the prevailing bearish trend.


