


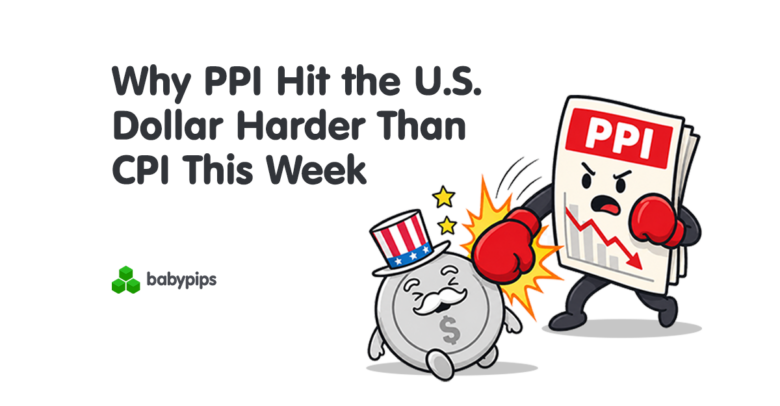

Two inflation reports landed this week, just one day apart. Wednesday’s Consumer Price Index matched forecasts, and the dollar barely blinked.
Then, Thursday’s Producer Price Index came in cooler than expected, knocking September rate hike odds from a coin flip to below 40%.
So, why did the lesser-known report pack the bigger punch?
It comes down to where each report sits in the inflation pipeline.
What Are PPI and CPI, and Why Does Core Matter?
Think of inflation as a relay race. The Producer Price Index (PPI) measures the prices businesses receive near the beginning of the supply chain. The Consumer Price Index (CPI) measures what households pay at the finish line.
The distance between those two points creates a time lag. Changes in producer prices can take one to three months to reach store shelves, which is why the Fed watches PPI for clues about where consumer inflation may be headed.
Within both indexes, core inflation strips out food and energy prices. A cyclospora outbreak sent lettuce prices down 16.4% in July, while geopolitical tensions helped push gasoline prices nearly 15% above their level a year earlier. Central banks can’t control either of those forces.
Core inflation filters out some of that volatility to reveal the broader trend that interest rate policy has a better chance of influencing. After all, a central bank setting rates based on a temporary swing in lettuce prices would be more likely to make policy decisions based on noise.
Promoted: Put Your Macro Read to Work
When inflation surprises reshape the Fed’s rate path, USD pairs can move quickly. Having a solid market read is only half the job. Traders also need the capital and discipline to act when their setup appears.
The5ers (4.7★ rating on 32K+ reviews) offers funded accounts and scaling programs that can help experienced traders turn market analysis into professional growth.
Learn more about The5ers & available discounts
Disclosure: We may earn a commission from our partners if you sign up through our links, at no extra cost to you.
What Did the CPI and PPI Reports Show This Week?
Earlier this week, the Bureau of Labor Statistics reported that headline CPI, which tracks prices across a broad basket of household goods and services, rose 0.1% in July, right in line with forecasts. The annual inflation rate came in at 3.4%.
Meanwhile, core CPI slowed to 2.5% year over year, its lowest level since March 2021.
Markets took one look and moved on. The dollar slipped 0.1%, Treasury yields edged lower, and September rate hike odds barely budged. See, the report confirmed what traders already expected, and markets don’t pay much for confirmation.
Thursday’s PPI report was a different story.
The annual rate slowed to 4.7% in July, below both the 5.0% forecast and June’s 5.5% pace. Producer prices were also flat for the month.
By Thursday’s close, September rate hike odds had fallen below 40%, while the dollar extended its decline.
What Do the Softer Prints Mean for the Fed’s September Decision?
The Federal Reserve holds its next policy meeting on September 15 and 16. Before this week, traders priced in roughly a 55% chance that the Fed would leave rates unchanged. After Thursday’s PPI report, the odds of a hike fell below 40%.
PPI can offer an early look at consumer inflation because changes in producer prices often take one to three months to reach shoppers. When producer inflation cools for consecutive months, the outlook for future consumer inflation tends to cool with it.
June’s annual PPI rate stood at 5.5%. In July, it slowed to 4.7%. When pressure eases earlier in the inflation pipeline, the urgency to raise interest rates usually eases too.
September isn’t the only meeting that matters, either. Rate expectations tend to shift across the entire policy path, not just one meeting at a time. If PPI keeps slowing, the case for another hike later this year could weaken as well.
Traders weren’t just repricing September on Thursday. They were nudging the whole path lower.
For now, Fed members remain divided. Richmond Fed President Tom Barkin has favored holding rates as inflation cools, while Cleveland Fed President Beth Hammack has pushed for a hike and questioned whether the slowdown will last.
Energy prices are still nearly 15% higher than a year ago, while wage growth continues to trail overall price growth. So, neither of this week’s reports exactly settled the debate.
How Does This Flow Into the Dollar?
Inflation data affects the dollar through interest rate expectations. Cooler inflation makes another Fed hike less likely. Lower expected interest rates point to lower returns on assets priced in dollars, making the greenback less attractive to foreign investors looking for yield.
That basic chain played out this week. EUR/USD edged higher after Thursday’s PPI report, while USD/JPY gave back some of its earlier gains as the expected gap between U.S. and Japanese interest rates narrowed slightly.
The real lesson is the difference between data that surprises and data that merely confirms. CPI landed almost exactly as expected, so markets had little reason to reprice. PPI came in below forecasts on a measure traders hadn’t priced as firmly. That new information changed the outlook for future CPI readings and September’s rate decision more than the CPI report itself did.
With hike odds now below 40% and no major Fed catalyst until Jackson Hole, the path of least resistance for the dollar is modestly lower in the near term. For USD pairs, the bigger repricing may still be coming at Jackson Hole.
What Should Traders Watch Next?
The PCE price index, or Personal Consumption Expenditures price index, arrives later this month. As the Fed’s preferred inflation gauge, it could either reinforce the cooling picture painted by CPI and PPI or muddy it.
Then comes Jackson Hole. With September hike odds still pretty even, every Fed speech and economic report between now and the September 15 meeting could move the needle.
This article walks through the CPI and PPI inflation pipeline and how a softer producer price reading shifted the Fed’s rate path this week, and if the mechanics connecting inflation data to central bank decisions and the dollar aren’t yet fully clear, Premium members can read our lesson:
📖 Inflation: The Force That Moves Central Banks
Reading this helps you understand how CPI, PPI, and core inflation are measured, why central banks watch producer prices as a leading indicator of consumer inflation, and how a shift in the inflation outlook translates into changes in rate expectations and currency moves.
And if you’re not a Premium subscriber yet, this is a good time to consider joining.
With Babypips Premium, you get full access to School of Pipsology lessons that help you understand the inflation mechanics behind major market moves, not just the headline numbers.


